Introducing the Grid Indicator for MetaTrader 4
If you're looking to enhance your trading experience, the Grid Indicator is a must-have tool for your MetaTrader 4 setup. This final version comes with several improvements based on trader feedback, making it faster and more reliable than ever.
Key Features of the Grid Indicator
- Enhanced Speed: Enjoy quicker operation with the latest updates.
- Accurate Bar Processing: The indicator now correctly processes any missing bars, ensuring a seamless experience.
- Visual Clarity: It replaces the standard grid with a more user-friendly layout, perfect for visual analysis.
Why Use the Grid Indicator?
This tool is ideal for visual trading, offering numerous applications that can aid in developing your trading systems. By using the Grid Indicator, you can easily spot recurring patterns in price behavior, giving you an edge in your trading strategy.
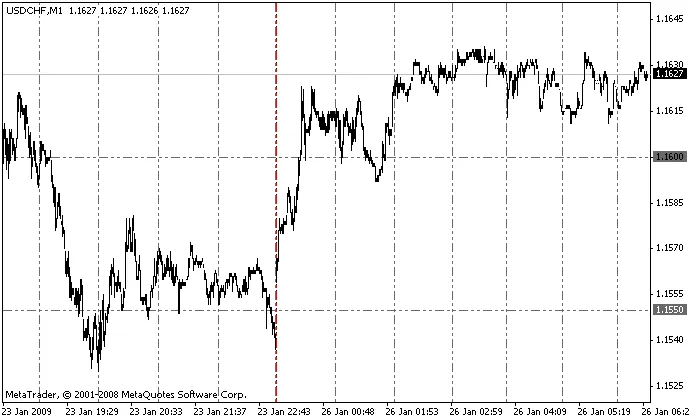
Understanding the Grid Lines
The vertical lines on the grid represent the start of each hour, with different colors signifying key times:
- Red Line: Marks the start of the week
- Blue Line: Indicates the start of the day
- Yellow Line: Represents the start of the month
Additionally, the horizontal lines are set at psychological levels, such as 1.3700 or 13750:
- Blue Lines: Shape lines
- Gray Lines: Intermediate levels
Visual Representation
Final Thoughts
With optimized code and fixed operational flaws, the Grid Indicator is a valuable addition to your trading toolkit. The improvements have been implemented based on popular demand, and the code includes detailed comments for your reference. Whether you're a novice or an experienced trader, this tool can help refine your approach to market analysis.


Comments 0