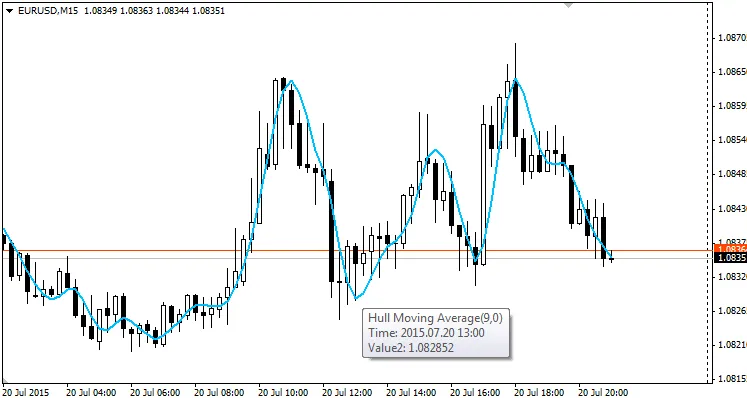
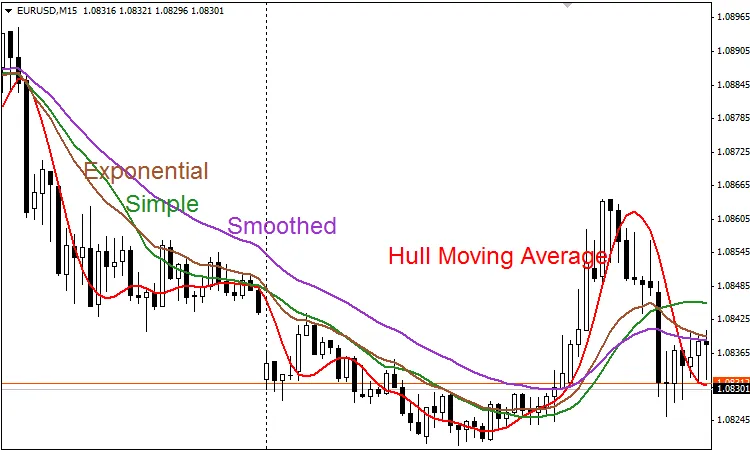
The Hull Moving Average (HMA), created by Alan Hull, is a game-changer for traders looking for a fast and responsive indicator. It’s designed to smooth out price data while significantly reducing lag, making it a favorite among active traders.
Alan Hull developed a unique equation to achieve this:
LWMA[square root(period), (2*LWMA(period/2, price)-LWMA(period, price)]
This clever formula results in a moving average that reacts quickly to price changes, allowing traders to stay ahead of the curve.
For a deeper dive into how the HMA works, check out this link: http://alanhull.com/hull-moving-average
There are two primary ways you can utilize the HMA:
- Single HMA Strategy: Watch for slope changes in the HMA. This can signal a prime opportunity to enter a long or short position based on the direction of the change. Always look for a solid setup, such as a candlestick pattern or a breakout from a support or resistance zone.
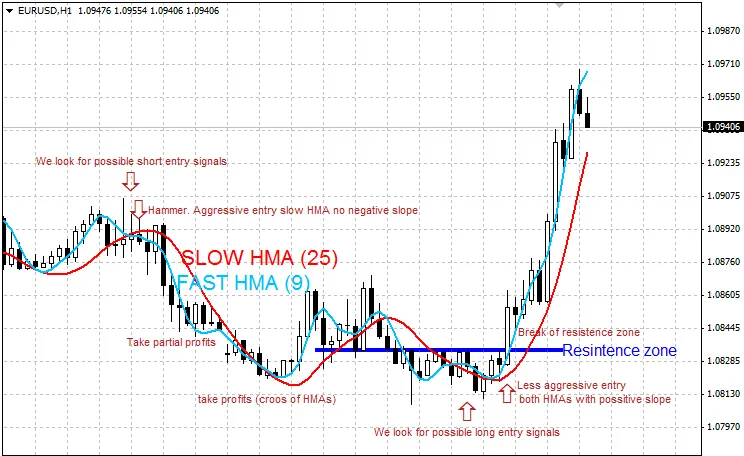
- Dual HMA Strategy: Use two HMAs, like HMA(9) and HMA(25). This approach focuses on the typical crossover of averages. The same principle applies here: monitor slope changes for exit signals. Keep in mind that, like all moving averages, the HMA can produce false signals in ranging markets.
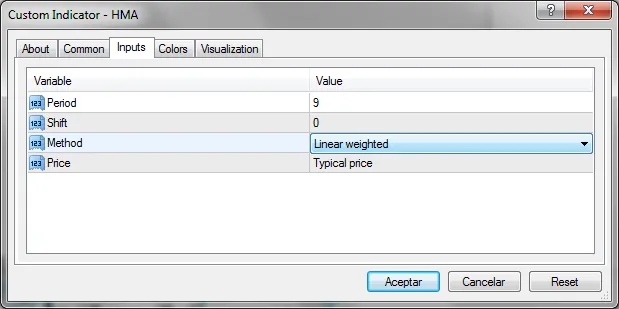
I've also customized the code to allow for different types of moving averages in the calculation process, although this may stray from the traditional HMA. Personally, I prefer using the typical price to consider the overall price action from each candle.
In the code, under the "Custom indicator initialization function", you’ll spot this line:
SetIndexStyle(0,DRAW_NONE);
If you switch it to DRAW_LINE, you’ll see an additional line on your chart representing part of the equation:
2*LWMA(period/2, price)-LWMA(period, price)
This calculation precedes the HMA computation but lacks the smoothing effect from applying a moving average to another moving average. You can utilize these lines similarly to how you would with two HMAs of different periods.


Comments 0