Description:
If you're looking to level up your trading game, understanding tick charts is key. This handy indicator for MetaTrader 4 allows you to record, store, and display data fully in a tick chart format, giving you a clearer view of market movements.
Image:
Structure of Tick File:
- iTime - The time of the tick.
- iOpen - The bid price at the start of the tick.
- iLow - The lowest bid price during the tick.
- iHigh - The highest ask price during the tick.
- iClose - The ask price at the end of the tick.
- iVolume - Time from the server, accurate to the second.
Instructions:
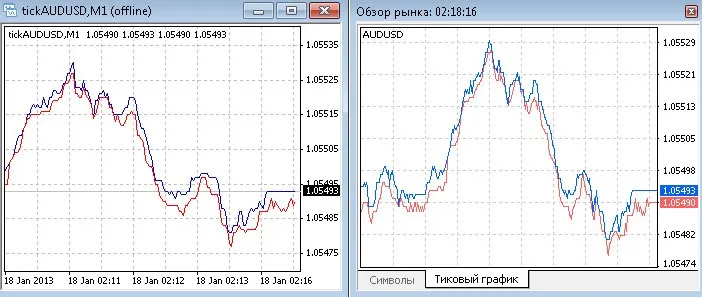
- To get started, attach the indicator to your chart. To open a tick chart, navigate to File ->Open Offline -> and select the symbol with the prefix 'tick'. For example, you might use tickAUDUSD,M1.
Pro Tips:
- Once you've added the indicator, save the template as 'default'. This way, whenever you open any chart, the tick data will be automatically recorded.
- Make sure to open the symbols you want to record and save them to your profile. Just go to File ->Profiles -> and select your profile to open all the necessary charts.
To ensure your records continue smoothly after an unexpected terminal shutdown, don't forget to use the SandyE-7-Recovery script!


Comments 0