The Normalized Volume indicator is a handy tool designed to give you a clearer picture of market activity by showing the normalized volume values. It presents the average trading volume over a specified range in an easy-to-read colored histogram, complete with a threshold value for better analysis.
This indicator comes with two important input parameters:
- Period - This is your normalization period, which determines how far back you want to analyze the volume data.
- Threshold - This sets the threshold level for interpreting the volume data.
How It Works:
VolumeNorm = Volume / MA * 100.0
Where:
MA - SMA(Volume, Period)
Volume - tick volume
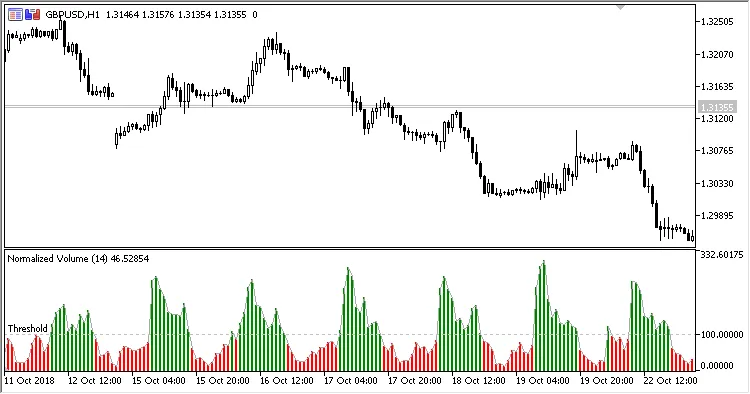
- If VolumeNorm is greater than the Threshold, the histogram bars will be colored green.
- If it’s less, the histogram bars will show up red.


Comments 0