Hey fellow traders! Today, let's dive into an interesting tool that can help us navigate the markets more effectively: the SeNSetiVe indicator.
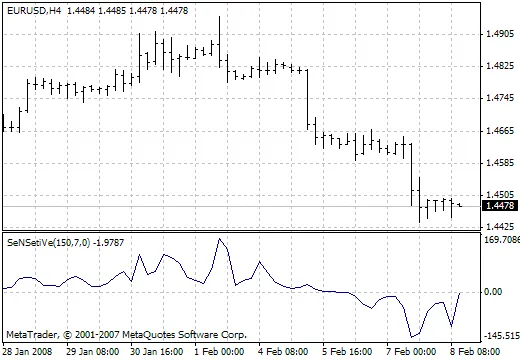
The SeNSetiVe indicator is a nifty tool that highlights market movement direction based on when the zero line is crossed. Here’s the rundown:
- Crossing from below the zero line? It’s a signal to buy.
- Crossing from above? Time to sell.
Now, let’s break down some key variables you need to know to make the most of this indicator:
Variables:
- SPerioD: This is the period setting, typically ranging from 100 to 200. Keep in mind that lower values (below 100) can lead to a lot of false signals. For hourly charts, an optimal setting is between 160-180, while for smaller time frames, aim for 100-160.
- SFactoR: Ranging from 1 to 10, this controls how sensitive the indicator is to rapid changes in market trends. The sweet spot is usually around 5-7.
- ShiFt: This parameter adjusts the indicator’s position relative to the zero line.
That’s a quick overview of the SeNSetiVe indicator! It’s an excellent addition to your trading toolkit, especially if you’re looking to time your entries and exits more precisely. Happy trading!


Comments 0