Hey there, fellow traders! Today, we're diving into a tool that can help sharpen your trading strategies—the Volatility Indicator. This nifty little gadget calculates the difference between the highest highs and the lowest lows of candlestick prices over the last 20 bars, which is the default parameter. Pretty cool, right?
The output you get from this indicator is displayed in points, giving you a clear view of market volatility.
Input Parameters:
extern int N=20; // period of the channel
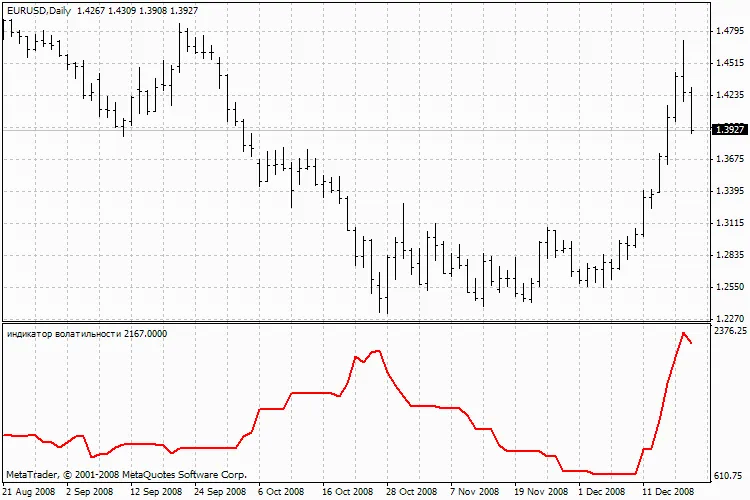
Volatility Indicator
Using the Volatility Indicator can give you insights into potential price movements, helping you make informed decisions in your trading journey. It's all about understanding how much the price is moving within a set timeframe, giving you a heads-up on when to enter or exit trades.
So, give it a whirl and see how it fits into your trading toolkit!


Comments 0