General Information
Every candlestick on your Forex chart represents a specific number of ticks that contribute to its formation. While we refer to this as Volume, it doesn't directly equate to actual trade volumes. Nonetheless, tick volume can provide insights similar to real volume data.
The tick information prior to applying the indicator is sourced from a specialized tick file, created using the Ticks Collector. You can also download a pre-made tick file from the archive. If you don’t need historical rendering, the indicator will provide real-time values as new ticks come in.
About the ClusterBox Day Histogram Indicator
This indicator is a variant of the ClusterBox Histogram. The key difference lies in its fixed data collection interval. Unlike the ClusterBox Histogram, which displays tick volumes across a user-defined history range, the ClusterBox Day Histogram focuses on a 24-hour interval. This allows you to pinpoint price concentration levels for each day individually.
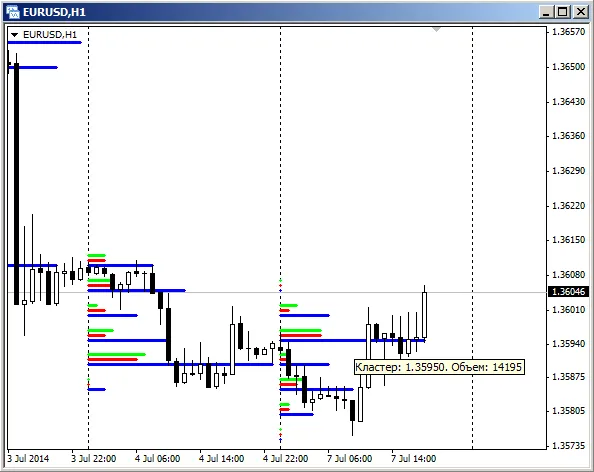
To get the exact tick volume corresponding to a cluster, simply hover your mouse over the line of interest. A tooltip will display the information about the price cluster and its tick volume.
For a deeper dive into using this indicator, check out the article on The Horizontal Cross-section of the Market.


Comments 0