Author: MetaQuotes Software Corp.
The HMA (Hull Moving Average) is a popular tool among traders, and today, we're diving into how you can use this modified version effectively on MetaTrader 4.
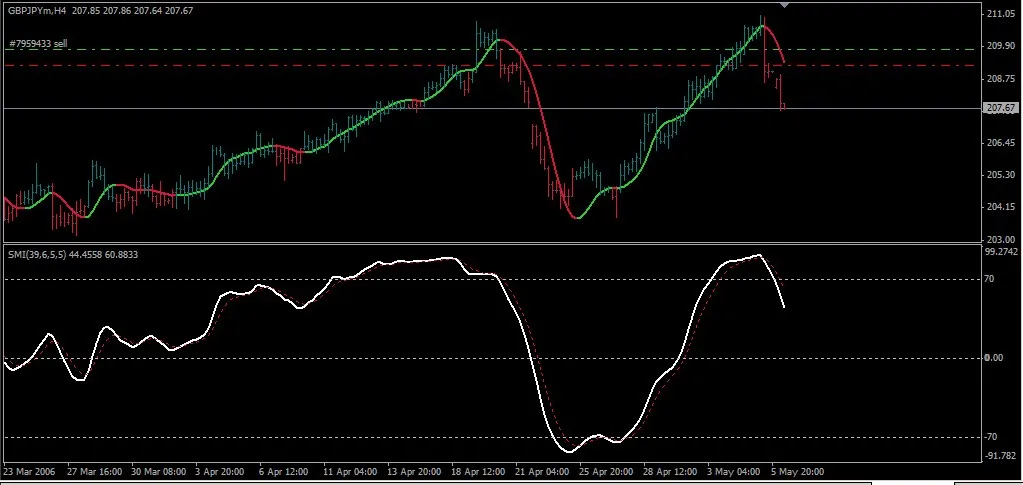
I've added an indicator that colors the bars based on the HMA, providing a visual aid for your trading strategy. Keep in mind that this tool is meant for illustrative purposes only.
Trading Rules with HMA
- Buy Signal: When the HMA line is green and tilted upwards, and the SMI crosses the signal line from below. Ensure the indicator isn't in the overbought zone (over 70).
- Sell Signal: When the HMA line is red and tilted downwards, and the SMI crosses the signal line from above. Make sure the indicator isn't in the oversold zone (below -70).
For your initial stop loss, set it at 150 points. Close half of your position once the SMI hits +80. For the remaining half, stick around for an exit signal after adjusting your stop loss. You should fully close your position when the HMA reverses and the SMI approaches its extremes (+70/-70).
This system tends to work best with yen pairs, so keep that in mind when setting up your trades!


Comments 0