Before diving into any trades, it's crucial to analyze the market properly. This involves identifying key support and resistance levels, as well as the overall trend direction—whether we’re looking at a bullish or bearish scenario.
The support and resistance levels are established based on the most recent numBars bars.
To pinpoint the trend, we utilize the Moving Average (MA) indicator. By setting the period with the maPeriod parameter, we can interpret the market: if the price is trading above the MA, we’re in a bearish trend; if it’s below, we’re in a bullish trend.
When the trend is bullish, we look to open a position upon breaking through the resistance level. Conversely, for a bearish trend, we seek to enter a position when the price breaks through the support level.
As for closing positions, we use a Stop Loss that’s strategically set at the support level for long positions and at the resistance level for short positions. Additionally, we can close positions if the price breaks through the support level (for a long position that’s in the profit zone) or through the resistance level (for a short position that’s also in profit). The EA also features a basic Trailing Stop with levels at 10, 20, and 30 points.
Input Parameters:
- numBars: This parameter defines the number of bars utilized to draw the support and resistance levels.
- maPeriod: This sets the period for the Moving Average.
Here’s a snapshot of the testing results for the EUR/USD pair through September:
Time Frame: H1
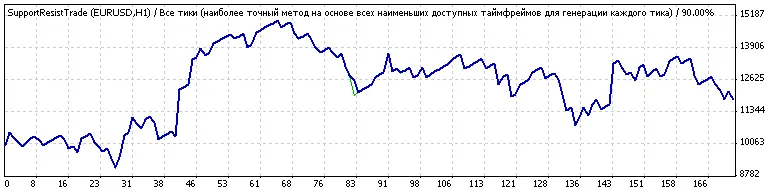
Keep in mind that the input parameters have not been optimized, with the default values set at: numBars = 55; maPeriod = 500.


Comments 0