Settings:
Here’s a quick rundown of the settings you need to configure for the RSI Predictor:
- start: The starting date for calculating the indicator.
- period: The timeframe for the RSI prediction.
- pr_period: The cluster size in bars.
- progn: The number of bars you want to predict.
- err: The error threshold for the cluster, which ranges from 0 to 100.
- glubina: The depth to search for similar clusters (0 searches the entire array).
- exp: The averaging method for the prediction based on the identified clusters (0 for simple moving average, 1 for linearly-weighted moving average).
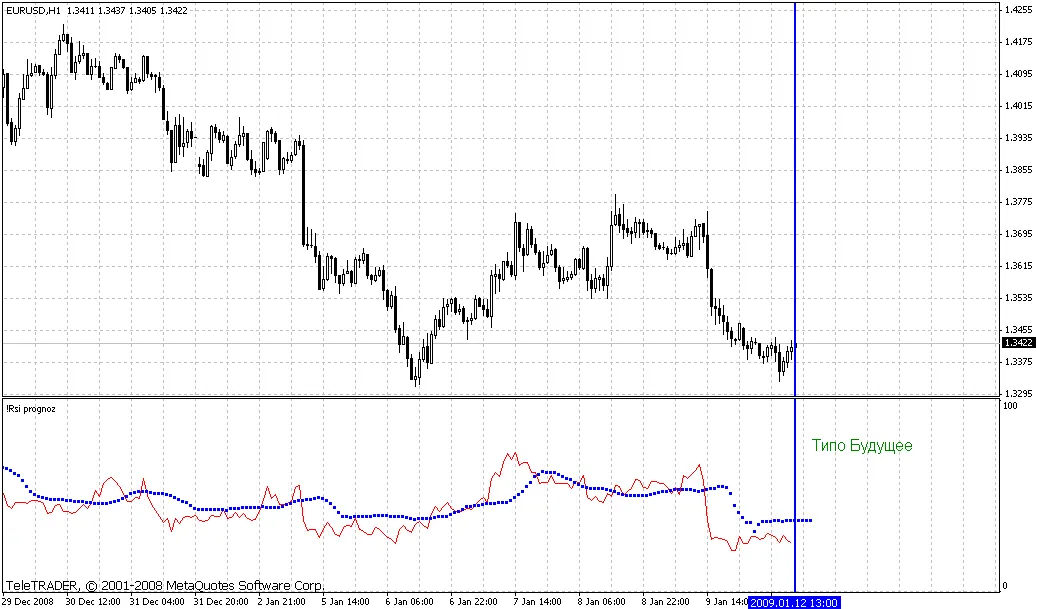
The concept is pretty straightforward: we take the historical RSI values over the defined pr_period bars and then check the indicator values after the progn bars. This way, we create a collection of indicator values and a pseudo-value that represents the outcome of this set, which we store in an array.
Next, we dive into the array at the specified glubina depth to look for any similar market situations from the past (within the error threshold defined by err) and analyze what those led to. The results we gather are then averaged using the specified exp method. This is how we wrap up our prediction calculation.


Comments 0