Negative Volume Index (NVI) is a versatile technical indicator available for advanced chart analysis on MT4 and MT5 platforms. It operates based on tick volume (or real volume in MT5) and comes with two valuable features:
- Support for multi-timeframe (MTF) functionality.
- Option to switch to the Positive Volume Index (PVI).
The NVI is displayed in a separate window below your main chart and doesn’t rely on any standard or custom indicators in its coding. This implementation is available for both MT4 and MT5 users.
What is the Negative Volume Index (NVI) Indicator?
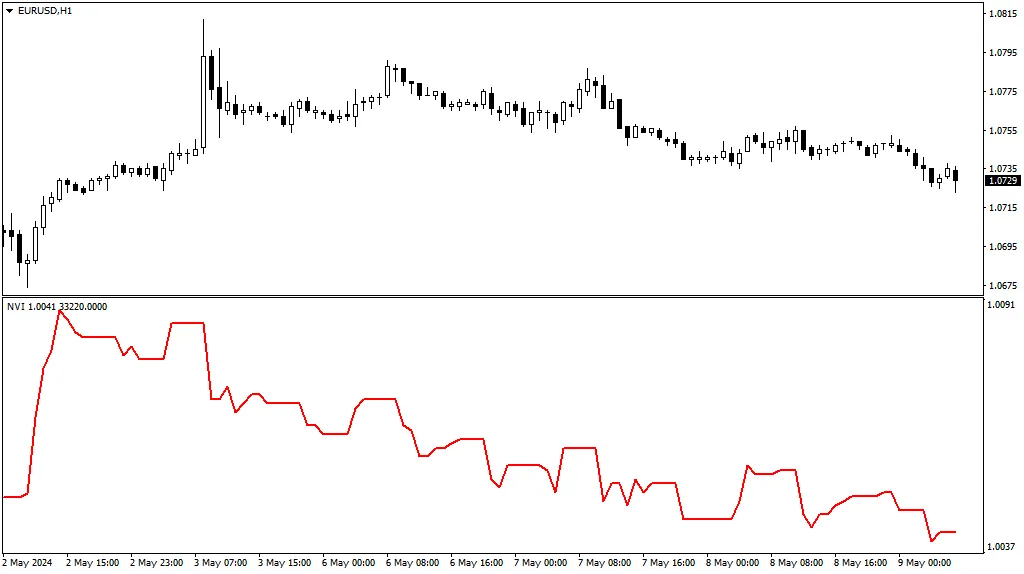
The Negative Volume Index (NVI) is a classic technical indicator developed by Paul L. Dysart in the early 20th century and later refined by Norman G. Fosback in 1976. It consists of a single oscillating line in a dedicated indicator window that either rises or falls based on the volume of bars that are lower than the preceding bar's volume.
How to Use the Negative Volume Index (NVI) Indicator
Classic NVI Strategy
The traditional interpretation of the NVI suggests that a subsequent movement of the NVI can confirm the strength of a trend. Essentially, a robust trend tends to persist even when volumes are declining. A crossover with its moving average can be viewed as a confirmation of the trend.
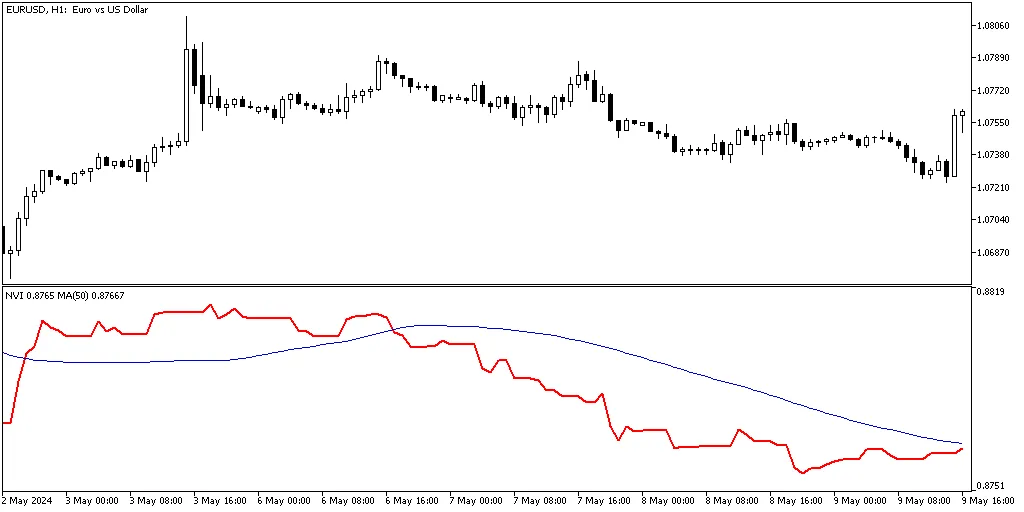
However, like any MA crossover strategy, this approach can generate false signals or lagging indicators.
NVI Divergence Strategy
Another approach involves analyzing divergences between the price and the NVI to identify potential trend reversals. For instance, if the price chart is making new higher highs while the NVI is forming lower lows, it may indicate an upcoming long-term downtrend:
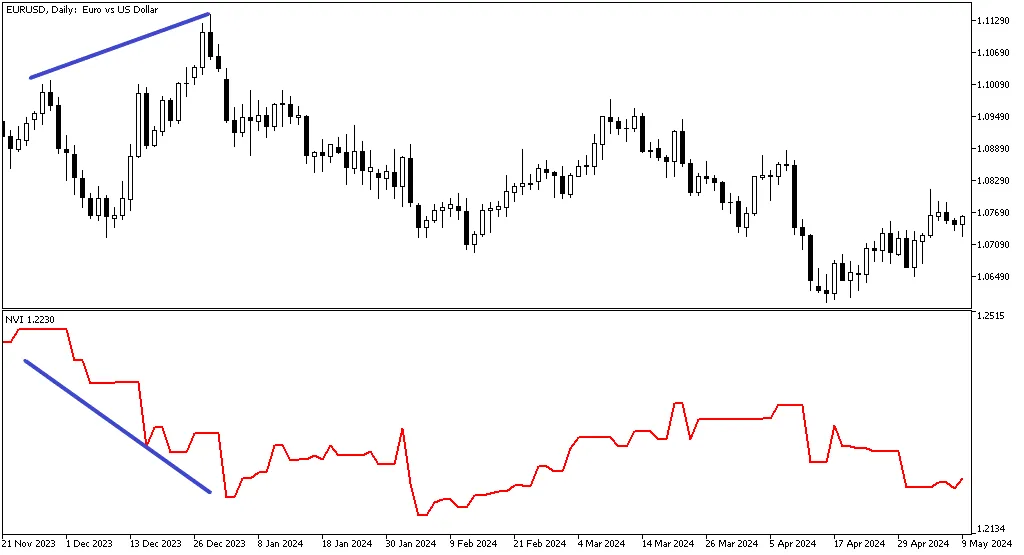
Unfortunately, these signals can be ambiguous or inaccurate. As with other divergence indicators, it’s wise to seek additional confirmations before making trade decisions.
Higher Timeframe Perspective
Our version of the NVI allows you to display higher timeframe NVI values on a lower timeframe chart. For example, here’s the EUR/USD on a daily chart, but we’ve attached the NVI indicator from the weekly timeframe:
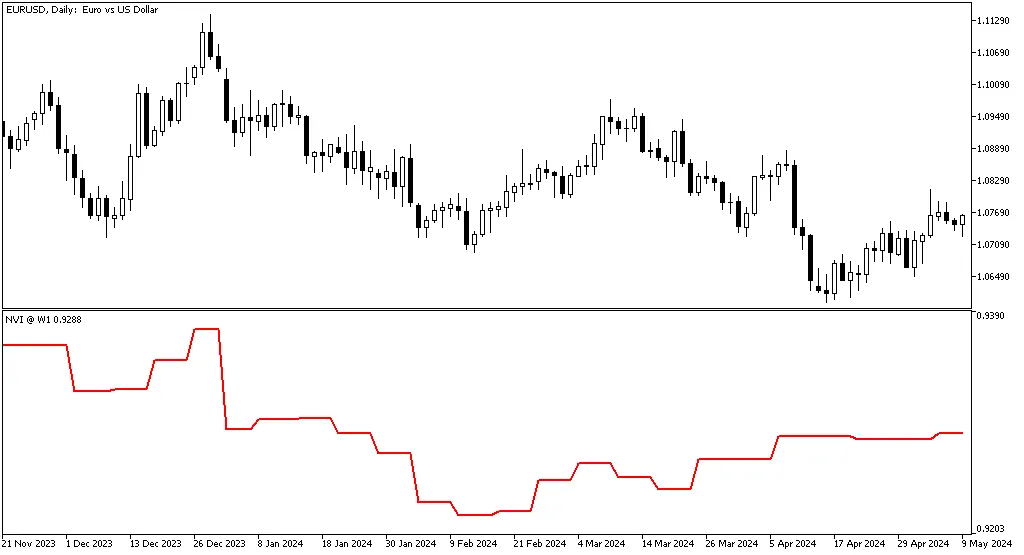

Since the volume on higher timeframe bars can differ significantly from lower timeframe bars, the resulting NVI curve may present a unique view of market conditions.
Positive Volume Index (PVI)
You can also switch the NVI indicator to calculate and display the Positive Volume Index (PVI). This enables traders to observe price movements that are accompanied by increasing volume. The PVI curve typically mirrors the price chart closely:

That said, many traders find the PVI to be less informative than the NVI.
NVI Input Parameters
- Indicator Shift (default = 0) — This parameter allows you to shift the indicator curve horizontally. A positive value shifts it right, while a negative value shifts it left.
- Timeframe (default = Current) — This specifies the timeframe for calculating the NVI line. Setting it to a higher timeframe will display the NVI on the current chart accordingly; this parameter is ignored if set to a lower timeframe.
- Positive Volume Index? (default = false) — When set to true, the indicator will calculate the Positive Volume Index instead of the Negative Volume Index.
- Volume Type (default = VOLUME_TICK) — This allows you to choose the type of volume used in calculations—tick volume or real volume. This option is available only in MT5.


Comments 0