SuperTrend Indicator – Precise Trend Detection Made Simple
Overview
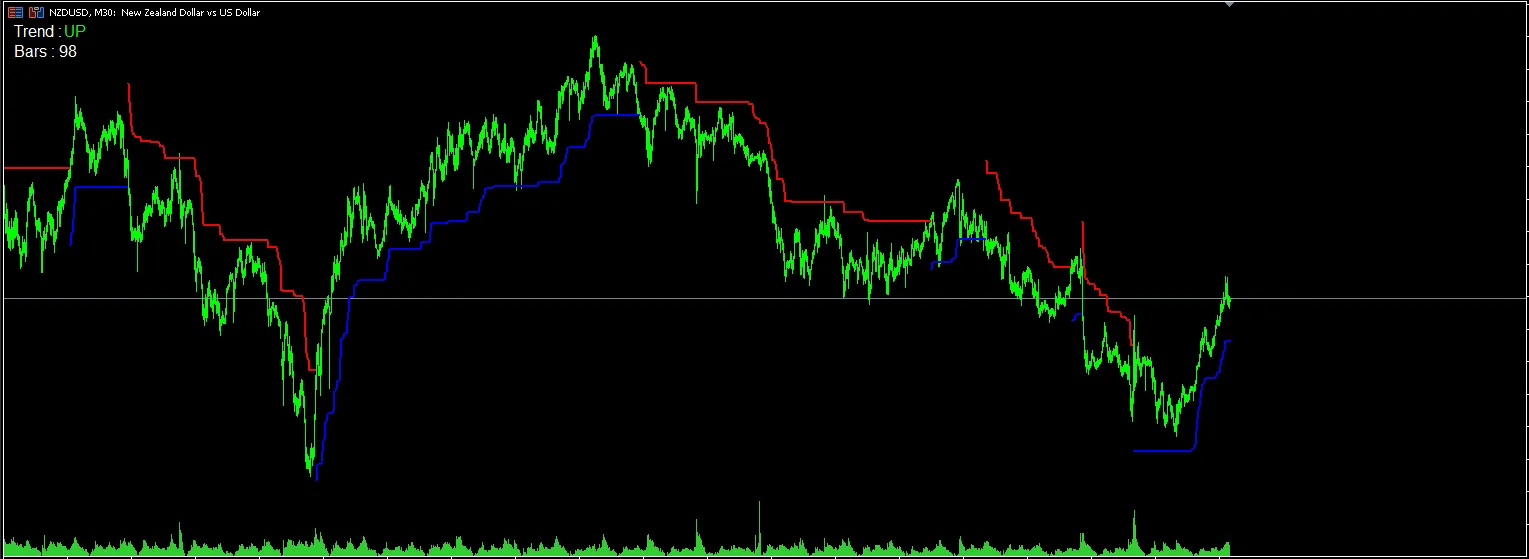
The SuperTrend Indicator is a fantastic tool that sits right on your price chart, giving you real-time insights into trend direction along with high-probability entry and exit signals. Whether you're a scalper, swing trader, or looking to make moves during the day, this indicator adjusts to market volatility using the ATR (Average True Range), ensuring you're quick to spot trend reversals.
Key Features
Real-time trend shifts highlighted with colored signals
Clear buy/sell signals based on price crossing the trend line
Built-in smoothing that filters out market noise
Compatible across all timeframes and instruments (Forex, stocks, crypto, indices)
Perfect for both newbies and seasoned traders
Easily integrates with any trading strategy (like EMA, price action, support/resistance)
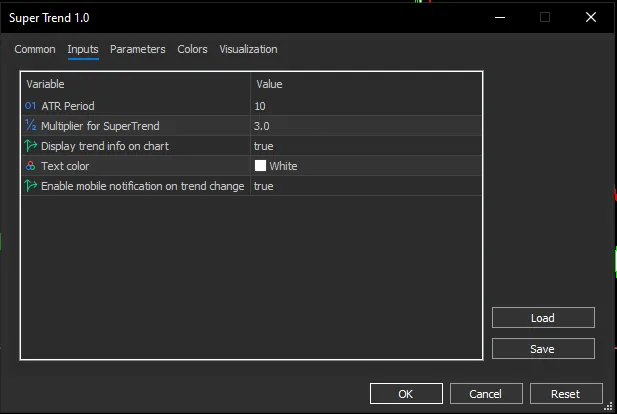
Input Parameters
| Parameter | Description | |
|---|---|---|
| ATR Period | Sets the number of bars used to calculate the Average True Range. Default: 10 | |
| Multiplier | The factor applied to the ATR to adjust the SuperTrend line. Default: 3.0 | |
| Price Type | Selects which price to apply the ATR (e.g., Close, High/Low, etc.) | |
| Line Width | Controls the thickness of the SuperTrend line | |
| Color Settings | Customize colors for uptrends and downtrends for better visibility |
How to Use
Buy Signal: When the price closes above the SuperTrend line, it indicates a bullish trend.
Sell Signal: When the price closes below the SuperTrend line, it signals a bearish trend.
For the best results, combine with other indicators (like RSI, EMA, or candlestick patterns).
Best Practices
Stick to using it on H1 or higher for clearer trend detection.
Consider adding ATR or Volume indicators for extra context.
Use the SuperTrend as a confirmation tool in a multi-indicator strategy or go solo for trend-following.
Take Your Trading to the Next Level
The SuperTrend Indicator is your ally in staying on the right side of the market while cutting through the noise. Whether you’re trading breakouts, trends, or pullbacks, this tool lends clarity and precision to your trading charts.


Comments 0