Author: Bifeancho
When it comes to trading, understanding volume indicators can be a game changer. The Buy-Sell Volume Indicator is a powerful tool that shows the amount of buying and selling activity for each bar on your chart.
Here’s how it works:
- The green line represents the volume of purchases.
- The red line indicates the volume of sales.
If you notice that both lines decrease in height, it’s a sign of low trading volume, which could mean less market activity. On the flip side, if the upper line (green) starts to drop while the lower line (red) is on the rise, this could signal a potential trend change.
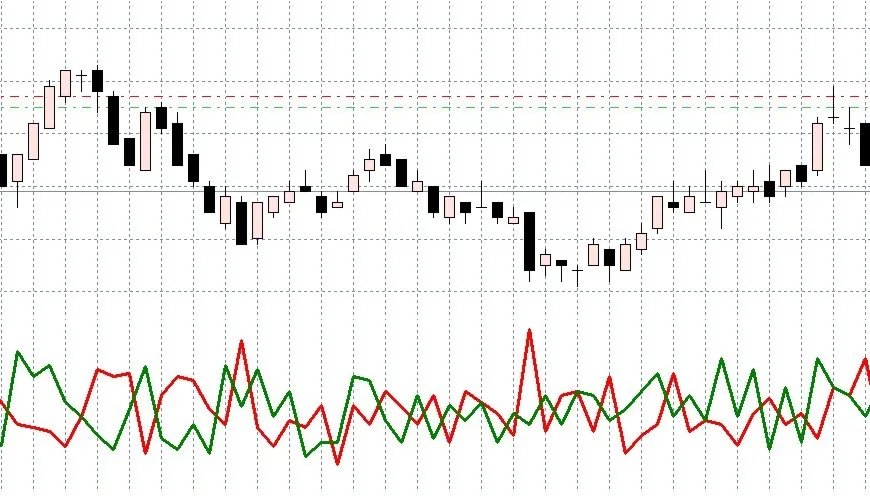
Buy-Sell Volume Indicator
Understanding these signals can help you make more informed trading decisions, so keep an eye on those lines!


Comments 0