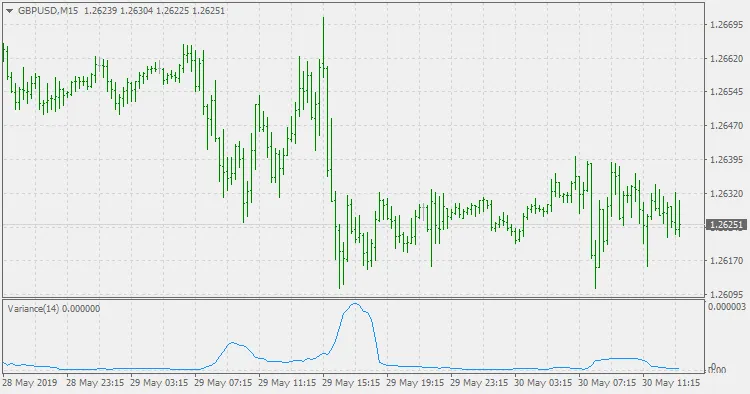
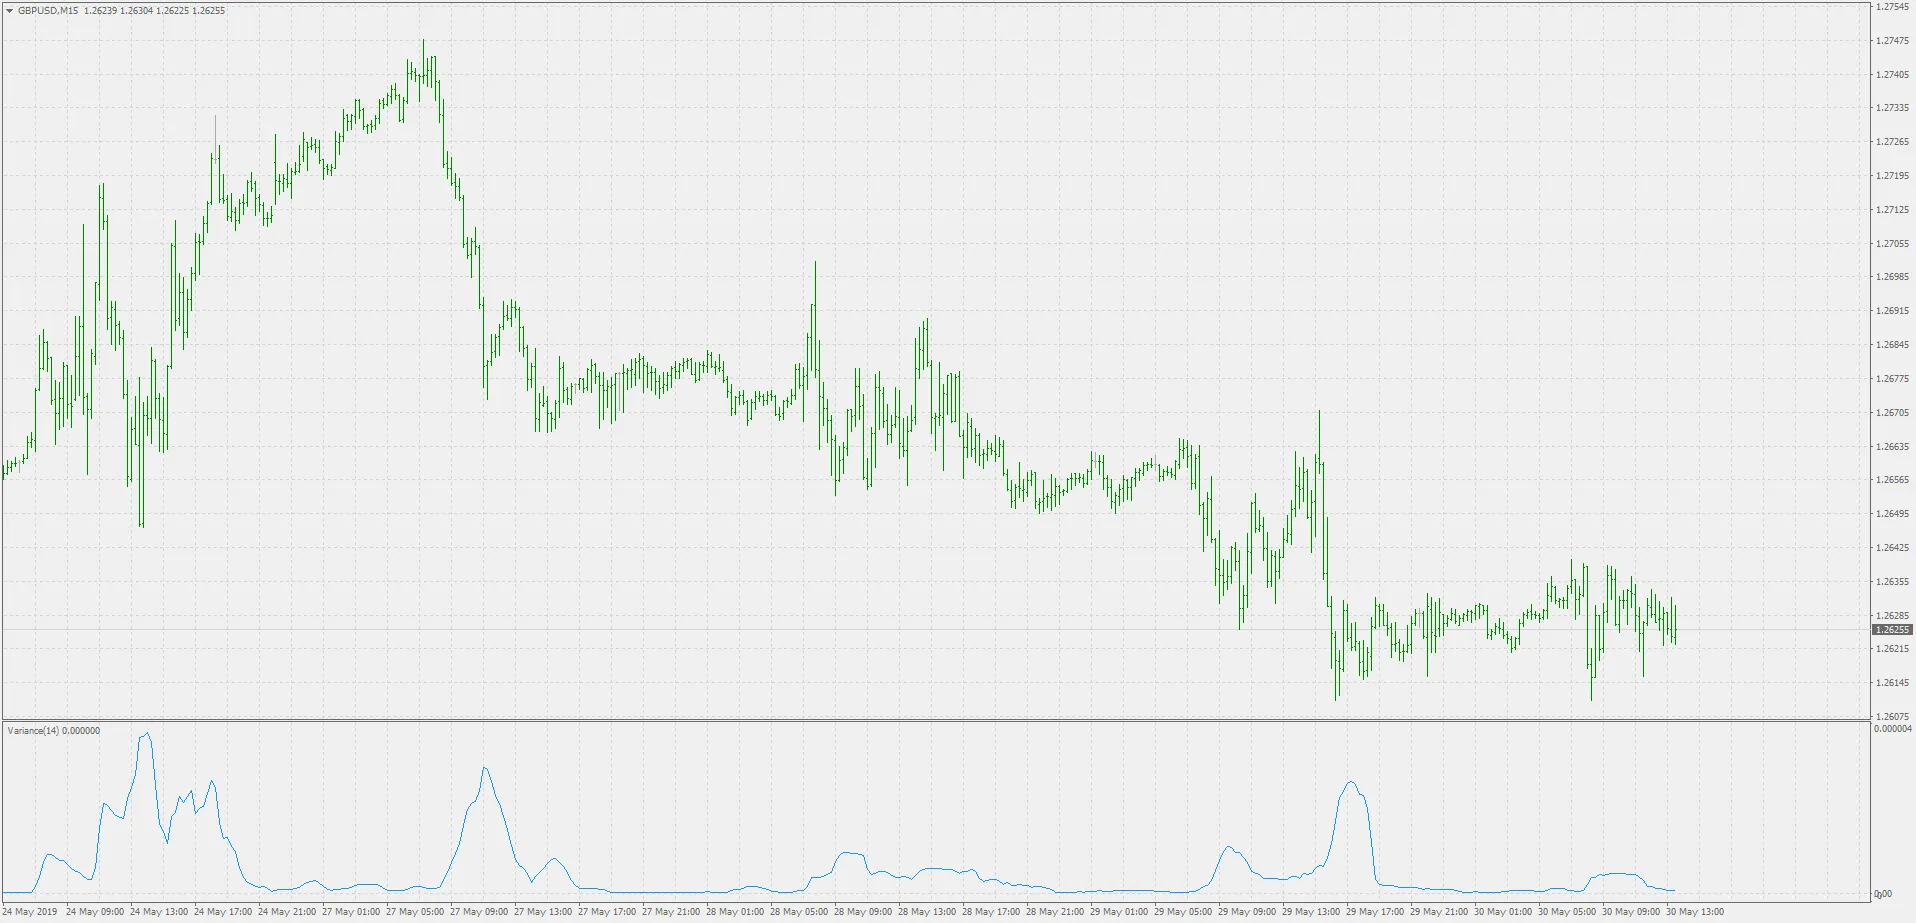
What is Variance?
Variance is a crucial metric that helps traders understand how much a dataset varies from its average. In simple terms, it shows us how spread out the data points are. If most of the data clump closely around a single value, you’ll see a small variance. On the flip side, if the data points are scattered all over the place, the variance will be larger.
Standard Deviation: The Link to Variance
When you take a sample, the standard deviation is essentially the square root of the variance. This relationship is vital for traders who want to assess risk and volatility in their trading strategies.
Welford’s Method for Accurate Calculation
To compute variance accurately, especially with smaller datasets, you might want to use Welford’s method. This single-pass approach minimizes errors that can occur when the variance is small compared to the square of the mean. In some cases, calculating the difference can lead to catastrophic cancellation, where significant digits are lost, resulting in large relative errors. Welford’s method helps avoid these pitfalls, ensuring your calculations are spot on.


Comments 0