Der Momo_Trades Expert Advisor (EA) wurde entwickelt, um die Strategie zu testen, die auf dieser Seite beschrieben ist. Ich teile diese Informationen hier, da sie bisher ungenutzt geblieben sind. Die Einstiege erfolgen gemäß der Strategie, die Ausstiege werden durch den TakeProfit geregelt. Während der Entwicklung habe ich das Auto-Lot-Management implementiert, das von Bookkeeper im Forum beschrieben wurde.
Hier sind die Ergebnisse des Forward-Tests. Die Optimierung wurde für den Zeitraum vom Jahresanfang bis zum 01.05.2008 durchgeführt.
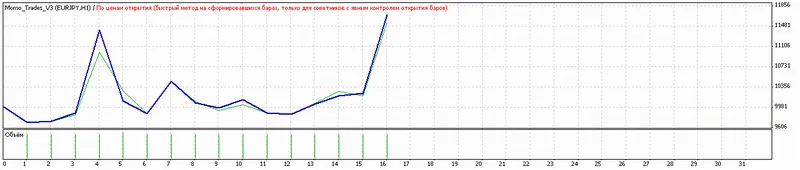
Strategietesterbericht
Momo_Trades_V3
Ukrsotsbank-MT4 (Build 216)
| Symbol | EURJPY (Euro vs Japanischer Yen) | ||||
| Zeitraum | 1 Stunde (H1) 2008.05.01 00:00 - 2008.07.01 23:59 (2008.05.01 - 2008.07.02) | ||||
| Modell | Nach Eröffnungspreis (nur für EAs mit expliziter Kontrolle der Kerzenöffnung) | ||||
| Parameter | Lots=0.1; Risiko=1; SL=95; TP=125; bu=12; magic=78977; PriseShift=4; AutoLot=true; CloseEndDay=false; BU=true; MaPeriod=24; MaShift=1; Fast=44; Slow=57; Signal=5; MacdShift=3; | ||||
| Balken im Test | 2048 | Ticks modelliert | 3094 | Modellierungsqualität | n/a |
| Fehler bei nicht übereinstimmenden Charts | 0 | ||||
| Startkapital | 10.000,00 | ||||
| Gesamter Nettogewinn | 1.702,92 | Bruttogewinn | 4.289,34 | Bruttoverlust | -2.586,42 |
| Profitfaktor | 1,66 | Erwarteter Gewinn | 106,43 | ||
| Absoluter Drawdown | 929,85 | Maximaler Drawdown | 2.261,95 (19,82%) | Relativer Drawdown | 19,82% (2.261,95) |
| Gesamtgeschäfte | 16 | Short-Positionen (Gewinn %) | 5 (80,00%) | Long-Positionen (Gewinn %) | 11 (45,45%) |
| Gewinntrades (% des Gesamt) | 9 (56,25%) | Verlusttrades (% des Gesamt) | 7 (43,75%) | ||
| Größter | Gewinntrade | 1.532,59 | Verlusttrade | -1.307,55 | |
| Durchschnittlich | Gewinntrade | 476,59 | Verlusttrade | -369,49 | |
| Maximal | konsekutive Gewinne (Gewinn in Geld) | 4 (1.842,01) | konsekutive Verluste (Gewinn in Geld) | 2 (-1.540,57) | |
| Maximal | konsekutive Gewinne (Anzahl der Gewinne) | 1.842,01 (4) | konsekutive Verluste (Anzahl der Verluste) | -1.540,57 (2) | |
| Durchschnittlich | konsekutive Gewinne | 2 | konsekutive Verluste | 2 | |
| № | Zeit | Typ | Order | Volumen | Preis | S / L | T / P | Gewinn | Bilanz |
| 1 | 2008.05.05 10:00 | buy | 1 | 1.30 | 162,89 | 161,90 | 164,14 | ||
| 2 | 2008.05.06 00:00 | swap close | 1 | 1.30 | 162,65 | 161,90 | 164,14 | -294,33 | 9.705,67 |
| 3 | 2008.05.06 00:00 | swap open | 2 | 1.30 | 162,6382 | 161,90 | 164,14 | ||
| 4 | 2008.05.07 00:00 | swap close | 2 | 1.30 | 162,66 | 161,90 | 164,14 | 26,74 | 9.732,41 |
| 5 | 2008.05.07 00:00 | swap open | 3 | 1.30 | 162,6482 | 161,90 | 164,14 | ||
| 6 | 2008.05.07 11:00 | modify | 3 | 1.30 | 162,6482 | 162,77 | 164,14 | ||
| 7 | 2008.05.07 12:00 | s/l | 3 | 1.30 | 162,77 | 162,77 | 164,14 | 149,37 | 9.881,78 |
| 8 | 2008.05.08 03:00 | sell | 4 | 1.30 | 160,79 | 161,78 | 159,54 | ||
| 9 | 2008.05.08 04:00 | modify | 4 | 1.30 | 160,79 | 160,67 | 159,54 | ||
| 10 | 2008.05.08 09:00 | t/p | 4 | 1.30 | 159,54 | 160,67 | 159,54 | 1.532,59 | 11.414,37 |
| 11 | 2008.05.13 09:00 | buy | 5 | 1.40 | 161,25 | 160,26 | 162,50 | ||
| 12 | 2008.05.13 11:00 | s/l | 5 | 1.40 | 160,26 | 160,26 | 162,50 | -1.307,55 | 10.106,82 |
| 13 | 2008.05.20 21:00 | buy | 6 | 1.30 | 162,40 | 161,41 | 163,65 | ||
| 14 | 2008.05.21 00:00 | swap close | 6 | 1.30 | 162,21 | 161,41 | 163,65 | -233,02 | 9.873,80 |
| 15 | 2008.05.21 00:00 | swap open | 7 | 1.30 | 162,1982 | 161,41 | 163,65 | ||
| 16 | 2008.05.21 11:00 | modify | 7 | 1.30 | 162,1982 | 162,32 | 163,65 | ||
| 17 | 2008.05.22 00:00 | swap close | 7 | 1.30 | 162,68 | 162,32 | 163,65 | 590,89 | 10.464,69 |
| 18 | 2008.05.22 00:00 | swap open | 8 | 1.30 | 162,6446 | 162,32 | 163,65 | ||
| 19 | 2008.05.22 03:00 | s/l | 8 | 1.30 | 162,32 | 162,32 | 163,65 | -398,09 | 10.066,60 |
| 20 | 2008.06.02 20:00 | sell | 9 | 1.30 | 162,17 | 163,16 | 160,92 | ||
| 21 | 2008.06.03 00:00 | swap close | 9 | 1.30 | 162,24 | 163,16 | 160,92 | -85,83 | 9.980,77 |
| 22 | 2008.06.03 00:00 | swap open | 10 | 1.30 | 162,2205 | 163,16 | 160,92 | ||
| 23 | 2008.06.03 07:00 | modify | 10 | 1.30 | 162,2205 | 162,10 | 160,92 | ||
| 24 | 2008.06.03 08:00 | s/l | 10 | 1.30 | 162,10 | 162,10 | 160,92 | 147,74 | 10.128,51 |
| 25 | 2008.06.05 22:00 | buy | 11 | 1.30 | 165,26 | 164,27 | 166,51 | ||
| 26 | 2008.06.06 00:00 | swap close | 11 | 1.30 | 165,06 | 164,27 | 166,51 | -245,28 | 9.883,23 |
| 27 | 2008.06.06 00:00 | swap open | 12 | 1.30 | 165,0482 | 164,27 | 166,51 | ||
| 28 | 2008.06.06 03:00 | modify | 12 | 1.30 | 165,0482 | 165,17 | 166,51 | ||
| 29 | 2008.06.09 00:00 | swap close | 12 | 1.30 | 165,03 | 165,17 | 166,51 | -22,32 | 9.860,91 |
| 30 | 2008.06.09 00:00 | swap open | 13 | 1.30 | 165,0182 | 165,17 | 166,51 | ||
| 31 | 2008.06.09 01:00 | s/l | 13 | 1.30 | 165,17 | 165,17 | 166,51 | 186,17 | 10.047,08 |
| 32 | 2008.06.24 13:00 | buy | 14 | 1.30 | 168,00 | 167,01 | 169,25 | ||
| 33 | 2008.06.24 19:00 | modify | 14 | 1.30 | 168,00 | 168,12 | 169,25 | ||
| 34 | 2008.06.24 20:00 | s/l | 14 | 1.30 | 168,12 | 168,12 | 169,25 | 147,17 | 10.194,25 |
| 35 | 2008.06.27 21:00 | sell | 15 | 1.30 | 167,59 | 168,58 | 166,34 | ||
| 36 | 2008.06.30 00:00 | swap close | 15 | 1.30 | 167,55 | 168,58 | 166,34 | 49,04 | 10.243,29 |
| 37 | 2008.06.30 00:00 | swap open | 16 | 1.30 | 167,5305 | 168,58 | 166,34 | ||
| 38 | 2008.06.30 08:00 | modify | 16 | 1.30 | 167,5305 | 167,41 | 166,34 | ||
| 39 | 2008.06.30 10:00 | t/p | 16 | 1.30 | 166,34 | 167,41 | 166,34 | 1.459,63 | 11.702,92 |


Kommentar 0