Hey traders! Today, let’s dive into the Color Day Indicator, a fantastic tool designed for MetaTrader 5 that helps you visualize bullish and bearish days at a glance.
This indicator colors your trading days based on the daily closing price relative to the opening price. If the daily close is higher than the open, it’ll show up in blue (you can tweak this in the settings). Here’s a sneak peek at how it works:
input color UP = Blue; // color for bullish days
On the flip side, if the daily close is lower than the open, it’ll be colored in red, also customizable:
input color DN = Red; // color for bearish days
Now, let’s talk about how the indicator works under the hood. It copies the opening and closing prices, along with the opening time for a specified number of days, which we’ll call Days:
CopyTime(NULL,PERIOD_D1,0,Days+1,tm);
      CopyOpen(NULL,PERIOD_D1,0,Days+1,op);
      CopyClose(NULL,PERIOD_D1,0,Days+1,cl);
These values get stored in arrays:
datetime tm[];
double op[];
double cl[];
Before you slap the indicator on your chart, make sure to set the dimensions of these arrays:
int OnInit()
  {
//--- mapping indicator buffers
   Comment("");
   ArrayResize(tm,Days);
   ArrayResize(op,Days);
   ArrayResize(cl,Days);
//---
   return(INIT_SUCCEEDED);
  }
Next up, we need to assign the values from the arrays to variables and determine the daily closing time time1:
datetime time0=tm[i];
      datetime time1=time0+3600*24;
      double dopen=op[i];
      double dclose=cl[i];
Now, let’s use the PutRect() function to draw rectangles on our chart:
void PutRect(string name,datetime t1,double p1,datetime t2,double p2,color clr)
  {
   ObjectDelete(0,name);
//--- create rectangle by the given coordinates
   ObjectCreate(0,name,OBJ_RECTANGLE,0,t1,p1,t2,p2);
//--- set rectangle color
   ObjectSetInteger(0,name,OBJPROP_COLOR,clr);
//--- enable or disable filling the rectangle
   ObjectSetInteger(0,name,OBJPROP_FILL,true);
  }
Now it’s time to color the day based on price movement:
if(dclose<dopen) PutRect("Rect"+(string)dopen,time0,dopen,time1,dclose,DN);
      if(dclose>dopen) PutRect("Rect"+(string)dopen,time0,dopen,time1,dclose,UP);
Next, we’ll loop through all the days specified in the Days parameter:
for(int i=0;i<=Days;i++)
     {
      CopyTime(NULL,PERIOD_D1,0,Days+1,tm);
      CopyOpen(NULL,PERIOD_D1,0,Days+1,op);
      CopyClose(NULL,PERIOD_D1,0,Days+1,cl);

      datetime time0=tm[i];
      datetime time1=time0+3600*24;
      double dopen=op[i];
      double dclose=cl[i];

      if(dclose<dopen) PutRect("Rect"+(string)dopen,time0,dopen,time1,dclose,DN);
      if(dclose>dopen) PutRect("Rect"+(string)dopen,time0,dopen,time1,dclose,UP);
    }
Lastly, when it’s time to clean house and remove the indicator from your chart, the DeleteObjects() function comes into play:
void DeleteObjects()
  {
   for(int i=ObjectsTotal(0,0,OBJ_RECTANGLE)-1;i>=0;i--)
     {
      string name=ObjectName(0,i,0,OBJ_RECTANGLE);
      if(StringFind(name,"Rect",0)>=0) ObjectDelete(0,name);
     }
  }
And when you’re done, just remove the created objects from the chart:
void OnDeinit(const int reason)
  {
   Comment("");
   DeleteObjects();
  }
Settings:
input int   Days = 11;  // specify the number of days for the calculation
input color UP = Blue;  // color for bullish days
input color DN = Red;   // color for bearish days
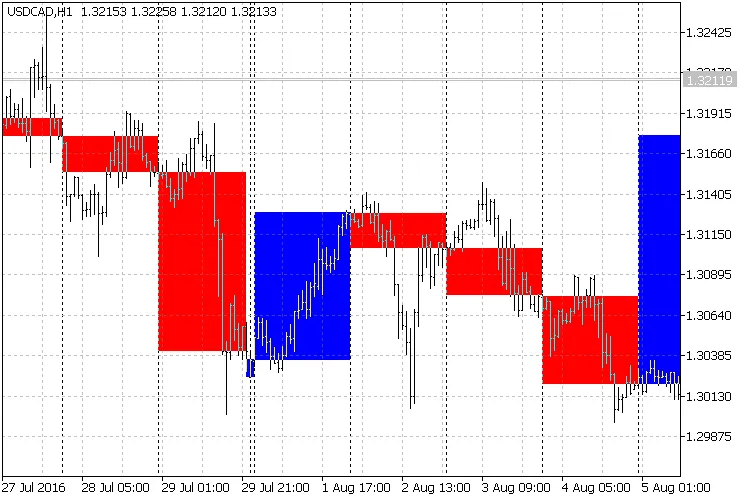
Fig. 1. The Color Day Indicator in action on the chart
Pro Tips:
- The Color Day indicator serves as a visual trading assistant, making it easier to identify market trends.


Comments 0