Unlocking the Power of Reverse Engineered RSI
Have you ever wanted to see how the Relative Strength Index (RSI) interacts with actual market prices without bouncing between screens? Well, the Reverse Engineered RSI is here to save the day!
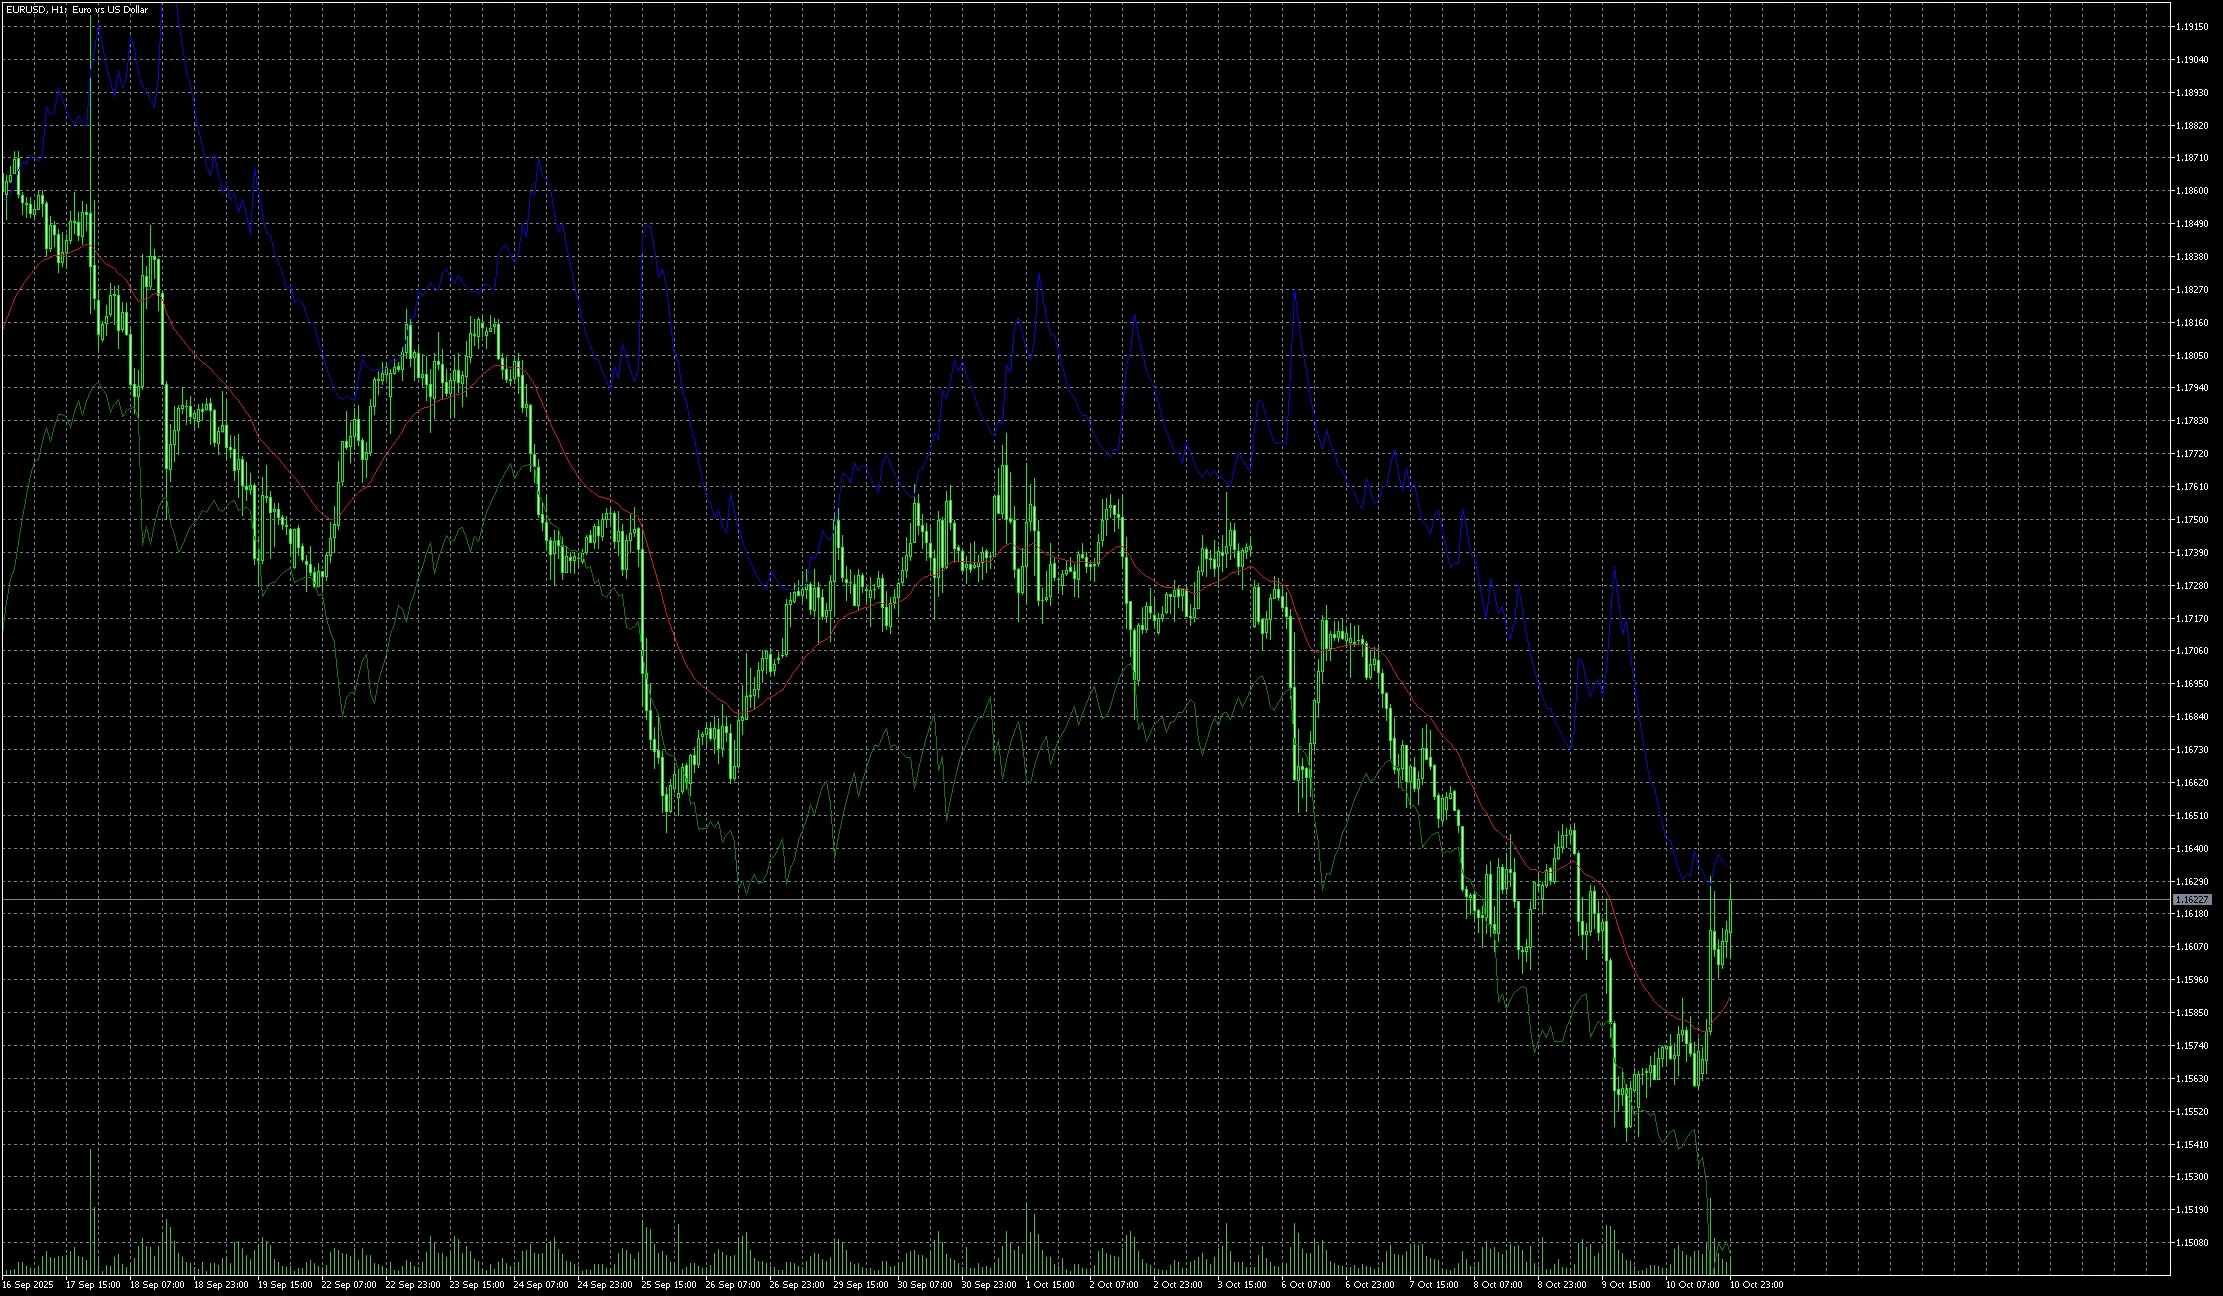
This nifty tool projects the traditional RSI levels — 30, 50, and 70 — straight onto your price chart rather than hiding them in the oscillator window. This straightforward layout allows traders like us to quickly identify where the RSI indicates overbought and oversold conditions, as well as the equilibrium zones.
By having these levels directly on the chart, you can easily pinpoint key support and resistance levels and spot potential reversal points without the hassle of flipping back and forth between views. It’s all about making your trading more streamlined and intuitive!


Comments 0