The RSI Overlay indicator is a powerful tool that transforms your trading charts into colored candles based on the Relative Strength Index (RSI) data. It's a great way to get a quick visual cue on market momentum.
Adjustable Parameters
This indicator comes with five customizable settings that allow you to tailor it to your trading style:
- Data RSI Compare Mode
- RSI vs Level 50: The RSI line is compared to the level 50.
- If the RSI is above 50, bullish candles appear in green and bearish candles in light green.
- If it's below 50, bearish candles turn red and bullish ones light red.
- RSI vs OB/OS Levels: This mode looks at overbought and oversold levels.
- If the RSI is above the overbought level, bullish candles are green while bearish candles are light green.
- If it's below the oversold level, bearish candles are red and bullish ones light red.
- Current and Previous RSI Values: This comparison shows the current and previous RSI values.
- If the RSI values are rising, bullish candles are green and bearish candles are light green.
- If the values are falling, bearish candles turn red and bullish ones light red.
- RSI vs Level 50: The RSI line is compared to the level 50.
- RSI Period: Set the period for RSI calculations.
- RSI Applied Price: Choose the price you want the RSI to be based on.
- RSI Overbought Level: Specify your overbought threshold.
- RSI Oversold Level: Specify your oversold threshold.
Visual Representation
Here's how the indicator visually represents different market conditions:
- If the RSI is above the overbought level, bullish candles are colored green, with light green for bearish candles.
- If the RSI is below the oversold level, bearish candles are red, and bullish ones are light red.
- In all other scenarios, the candles appear gray for neutral signals.
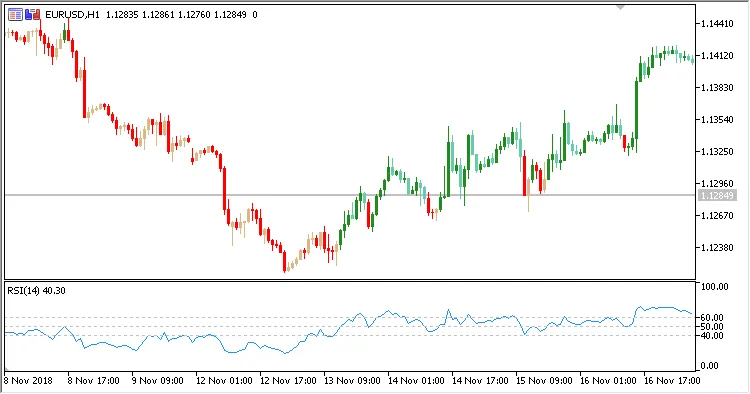
Fig. 1. RSI Overlay + RSI. Data RSI Compare mode = RSI vs Level 50
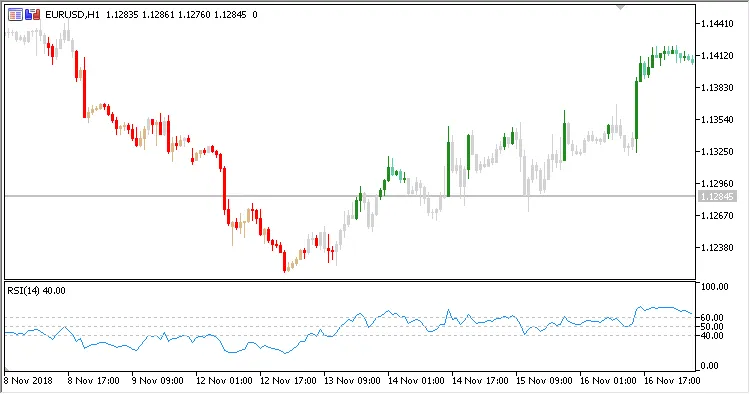
Fig. 2. RSI Overlay + RSI. Data RSI Compare mode = RSI vs OB/OS Levels
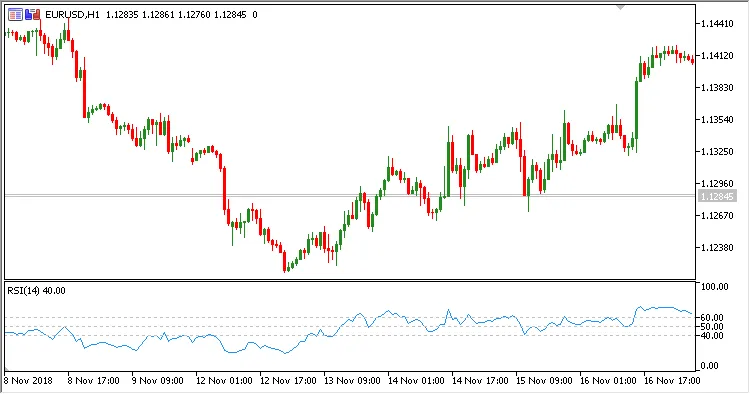
Fig. 3. RSI Overlay + RSI. Data RSI Compare mode = Current and Previous RSI Values


Comments 0