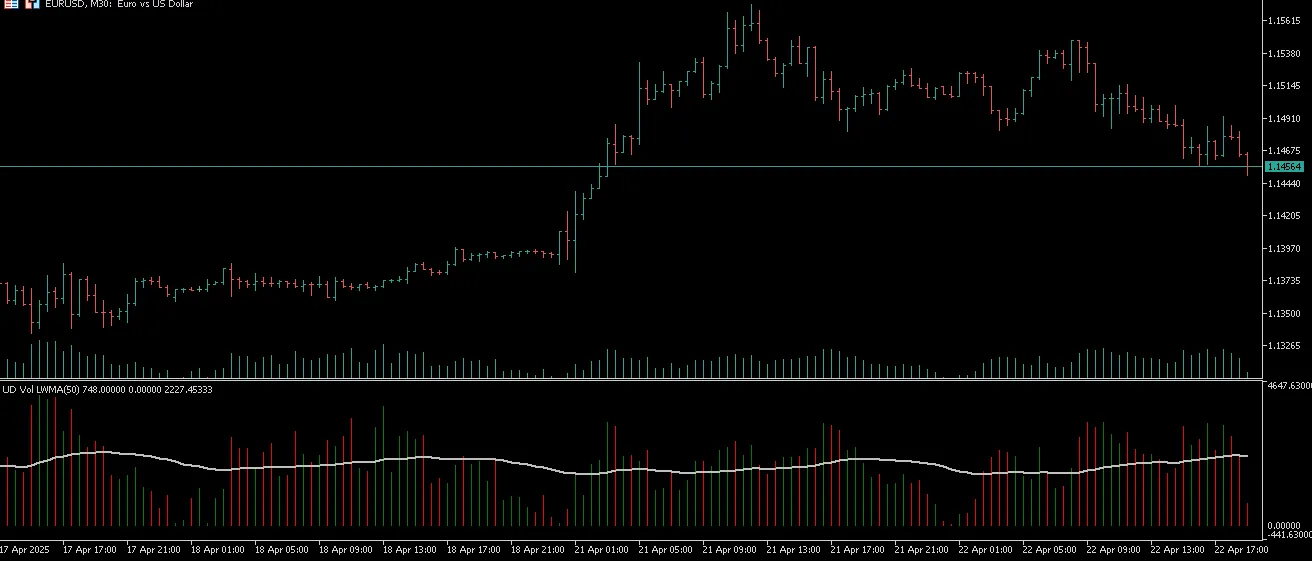
If you’re on the hunt for a solid way to analyze market trends, the Volume MA with candle color tracking is a classic tool that can elevate your trading game. This nifty indicator plots a moving average based on tick volume, rather than price, giving you a fresh perspective on market activity.
The beauty of this indicator lies in its ability to color-code the histogram bars according to the price action. This visual representation makes it easier to spot potential trading opportunities at a glance.
For those interested in the technical side, this is an MQL4 conversion, and you can check out the original code here.
When tick volume breaks above the moving average, it’s a telltale sign that market participation is ramping up. This can signal strong trends or a surge in volatility — definitely something to pay attention to!
On the flip side, if tick volume remains below the moving average, it often indicates lower liquidity. This scenario typically points to a quieter market or a period of consolidation, which can be crucial for your trading strategy.


Comments 0