Hey there, fellow traders! Today, I want to break down a handy little indicator that shows the difference between the open price of the current bar and the close price of the previous bar. You’ll find this indicator displayed in points at the top-left corner of your main chart window, and it can be a real game-changer in your trading strategy.
So, here’s how it works:
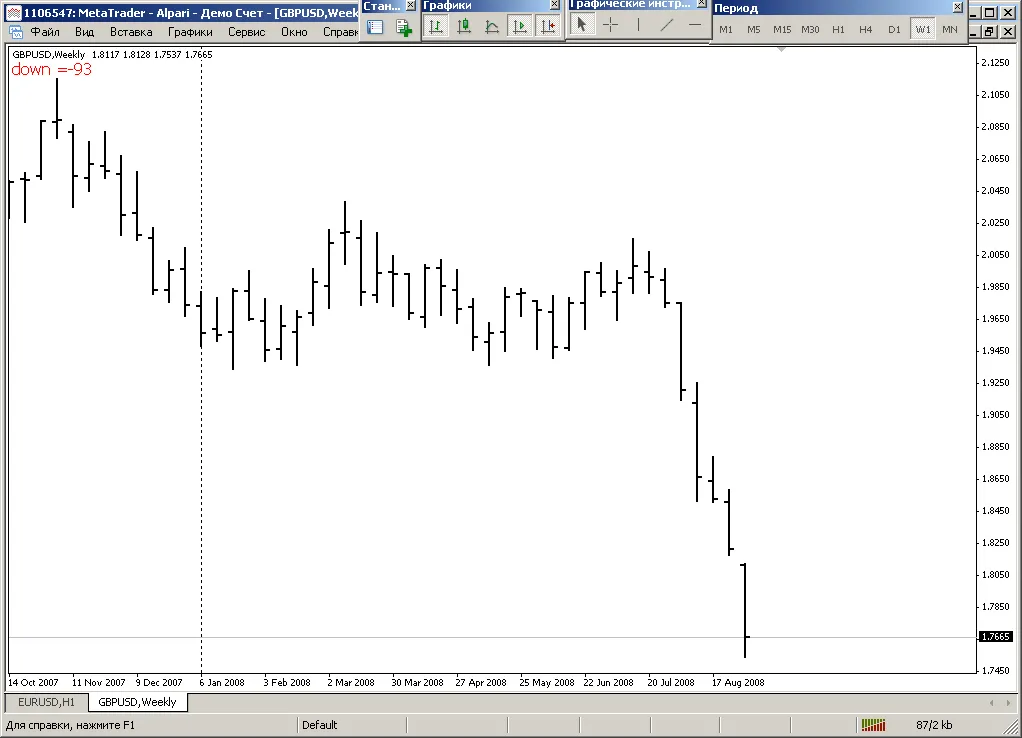
- Open Below Close: If the open price is below the close price, you'll see a "Down" mark along with a minus sign before the number. This indicates that the market is trending downward.
- Open Equal to Close: If the open price matches the close price, you’ll see a "Flat" mark. This means the market isn’t moving much, and it could be a signal to hold off on trades.
- Open Above Close: Lastly, if the open price is above the close price, the indicator will show an "Up" mark. This suggests a bullish trend, which can be a great opportunity for buying.
Keeping an eye on this indicator can help you make more informed trading decisions. It’s like having a little assistant that tells you how the market is moving. Happy trading!


Comments 0