General Information
Every candlestick on your Forex chart tells a story, and a big part of that story comes from the ticks that created it. While Forex charts show this as volume, it's important to note that this isn't the same as real trade volumes. Instead, think of tick volume as a close cousin to real volume data—it can provide valuable insights just the same.
To get the most out of your trading, you can use a special tick file that captures this information before you attach the indicator. You can create your own tick file using the Ticks collector, or you can grab a pre-made tick file from the archive. If you're not worried about historical rendering, you can keep an eye on real-time values as new ticks come in.
About the ClusterBox Indicator
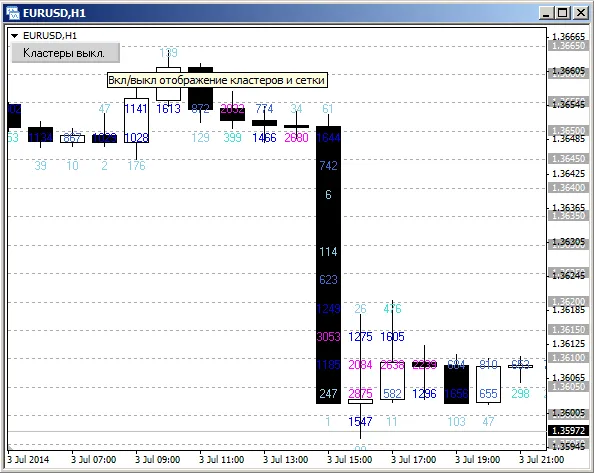
The ClusterBox indicator is a fantastic tool that breaks down the tick distribution within each candlestick. It does this by dividing it into clusters, each defined by its height, which you can adjust using the "Amount of points in one cluster" parameter. As such, each candlestick can feature a different number of clusters based on its height.
What's even cooler is how the size of the accumulated tick volume gets represented by color! The text label showing the number of ticks in a cluster will change color depending on the tick volume level.
You can customize the relationship between minimum tick volume levels and their corresponding colors in the settings. For instance, you can set the "Minimal volume. Level N" and "Color of level N" parameters to determine how tick volumes above a certain threshold will be visually represented. If a tick volume exceeds the value set in the "Minimal volume. level 5" parameter, it will display in the color you specified for that level.
For more in-depth information, check out The vertical cross-section of the market.


Comments 0