If you're looking for a straightforward multi-timeframe indicator that brings higher timeframe insights directly onto your current chart, you’ve come to the right place!
The core of this tool is the JMASlope indicator, developed by TrendLaboratory Ltd. (Copyright © 2005, TrendLaboratory Ltd.). To utilize a multi-timeframe indicator effectively, having a solid base indicator is essential.
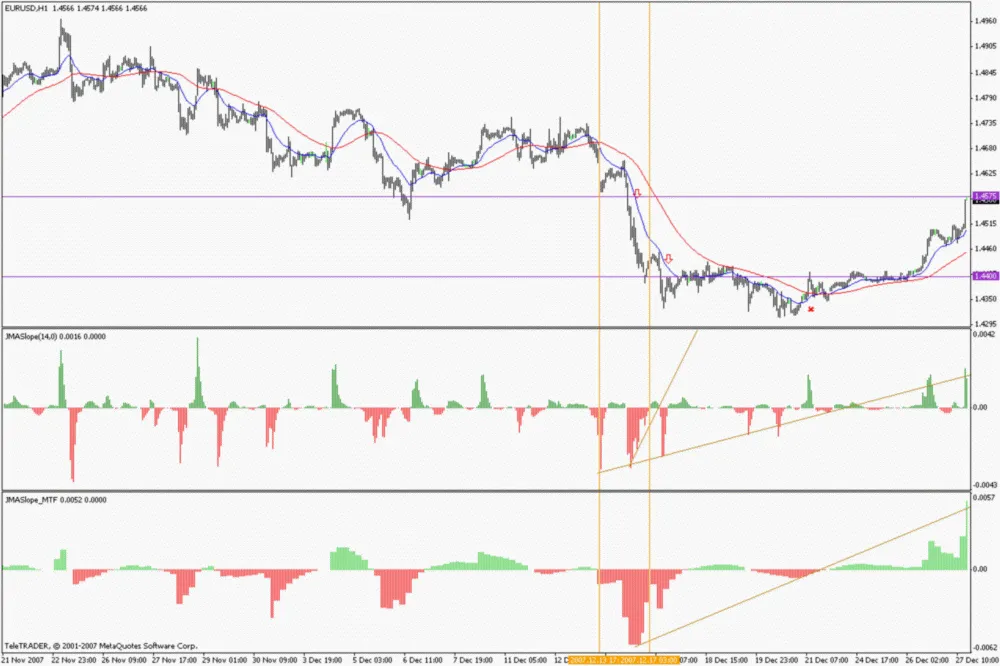
So, what does JMASlope do? It identifies price impulse peaks and the divergences between them. Additionally, it provides insights into impulse strength by comparing the sizes of previous peaks. This makes it a handy tool for traders.
I genuinely believe this indicator will be a game-changer for those into scalping and swing trading.
However, relying solely on this indicator on a single timeframe can lead to some inaccuracies, as it doesn’t provide a comprehensive view of the market. That’s where the JMASlope_MTF comes into play!
When you apply both the JMASlope and the multi-timeframe indicator on your chart, it paints a clearer picture of the current market dynamics. The multi-timeframe indicator will highlight broader market impulses, while the JMASlope will hone in on the structure and details of those impulses. This combo can be particularly beneficial for traders who use Elliott Wave analysis.
P.S. The beauty of this multi-timeframe indicator is its versatility! You can pair it with almost any basic indicator that has two INTEGER type input parameters, even if their names don’t match the original. Just make sure there are only two parameters and they are both of INTEGER type. To set it up, simply replace the indicator name in the input parameter INDICATOR with your chosen indicator, specify the timeframe, and set your first and second parameters. Voila! You’ll get a histogram of your base indicator across any timeframe.


Comments 0