If you're diving into the world of trading, understanding the RSI_BANDS_MA indicator can give you an edge. This tool combines the Relative Strength Index (RSI) with moving averages (MA) to help you identify market trends and potential buy or sell signals.
The MA is calculated using RSI data, while Bollinger Bands illustrate the trading channel. Here’s the scoop:
Trading Signals Explained
- Sell Signal: When the RSI enters overbought territory and begins to dip below the MA, it's a solid sign to consider selling.
- Buy Signal: Conversely, if the RSI drops into oversold conditions and crosses above the MA, it’s a good indicator to look for buying opportunities.
- Divergence Alert: If you spot a divergence between the price's MA and the MA indicator for the same period, take notice! This could signal a potential market reversal.
For best results, keep an eye on multiple timeframes. I recommend focusing on daily (D1), four-hour (H4), one-hour (H1), and five-minute (M5) charts. This way, you can get a comprehensive view of the market trends.
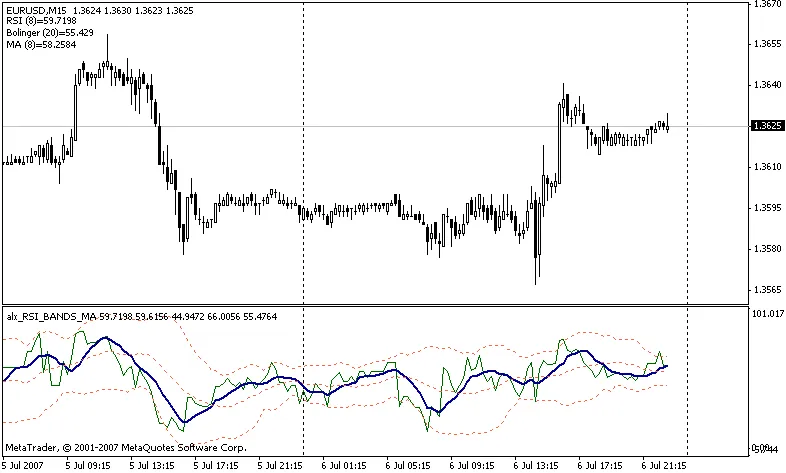
RSI_BANDS_MA Indicator
One of the best features of this indicator is that it’s fixed and doesn’t lag on ticks, allowing you to make quick, informed decisions as the market moves.


Comments 0