Check out the MT4 version of the original indicator here: https://www.mql5.com/en/code/22576
While MT4 has its limitations when it comes to indicator visualization, this version makes sure the boundaries are clear, even if the color zones are missing.
Understanding the Basics
The RSI (Relative Strength Index) is a go-to tool for many traders when making decisions, especially when it comes to spotting overbought or oversold conditions. However, it's easy to overlook how the market constantly adjusts to price changes. This means that the RSI can sometimes signal overbought or oversold conditions even after the market has already made its adjustments.
What’s New in This Version?
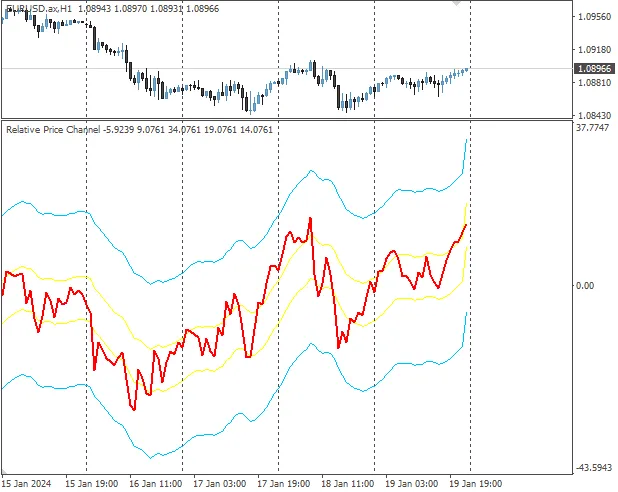
This updated version employs the RSI to establish high and low neutral zones utilizing a simple EMA (Exponential Moving Average) lag. In this context, the lag acts as a helpful ally; without it, breakouts could easily be missed. Only when the RSI crosses the upper or lower boundary should you consider a genuine overbought or oversold condition.
How to Use It
This indicator is particularly useful for spotting potential reversal points in the market. Keep an eye out for those significant RSI movements!


Comments 0