PriceVar% is an innovative indicator crafted to assess the percentage difference between the current price and a moving average. It effectively highlights the strength of market movements relative to a reference point, making it a valuable tool for traders.
How Does It Work?
If the closing price is above the moving average, the calculation is as follows:
Var = (High - MA) / MA * 100
If the closing price is below the moving average, the calculation changes to:
Var = (Low - MA) / MA * 100
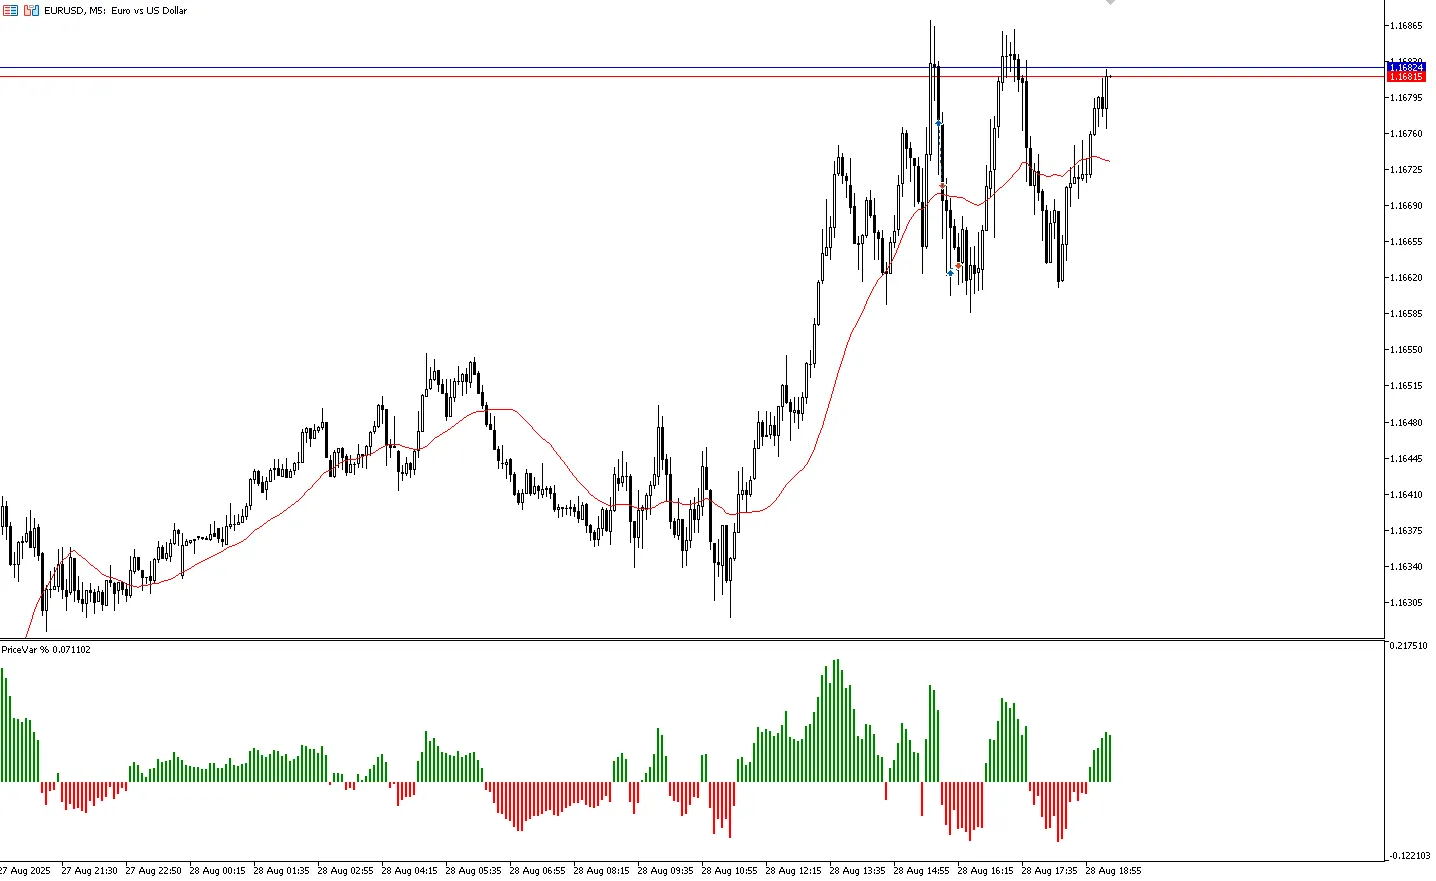
The result is presented as a percentage histogram (%):
Green → indicates when the price is above the average (suggesting buying pressure).
Red → shows when the price is below the average (indicating selling pressure).
Interpreting the Results
Positive values reflect the distance of the high from the average.
Negative values show the distance of the low from the average.
The greater the absolute value, the larger the percentage distance of the price from the average.
Practical Applications
Spotting overbought or oversold conditions relative to the average.
Evaluating percentage volatility surrounding the average.
Assisting in breakout or reversal strategies by confirming the strength of price movements.
Serving as a filter for automated trading systems (e.g., executing trades only when the percentage change surpasses a specific threshold).
Key Parameters
Average period (iPeriod): This defines the timeframe of the moving average used as a reference point.


Comments 0