What is Standard Deviation?
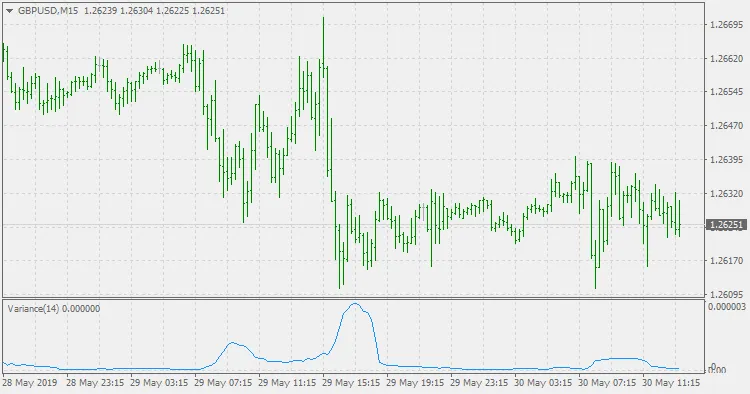
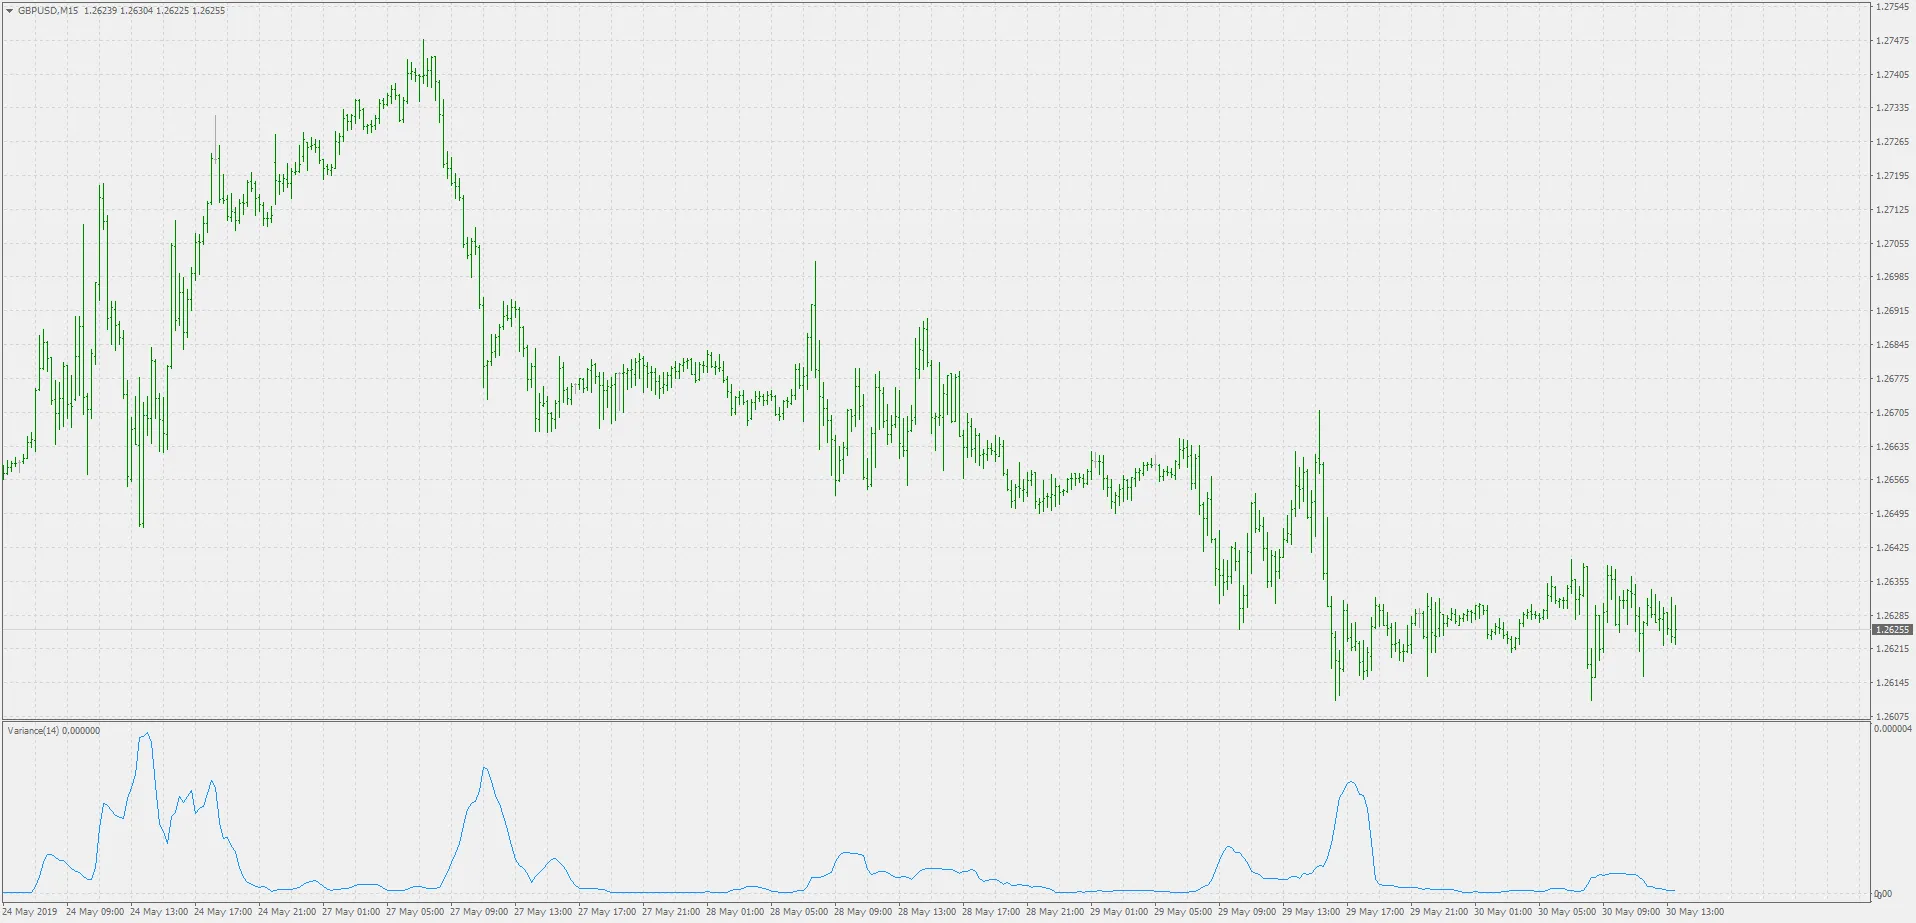
Standard deviation is a handy measure that shows how much a dataset varies from its average. It's like a compass for traders, helping us understand the volatility of the market. If the data points are tightly packed around the average, you’ll see a low standard deviation. On the flip side, if they’re spread out, that’s when you get a high standard deviation.
The Link Between Variance and Standard Deviation
In simple terms, the standard deviation is just the square root of the variance. It's a crucial concept to grasp if you want to dive deeper into market analysis.
Welford’s Method for Precision
For those of you looking for a more accurate way to calculate variance, you might want to check out Welford’s method. This technique allows you to compute variance in a single pass, which is particularly useful in avoiding errors that can occur if the variance is small compared to the square of the mean. When you're dealing with tight margins, this can save you from catastrophic errors where significant figures get lost, leading to a high relative error.


Comments 0