Description:
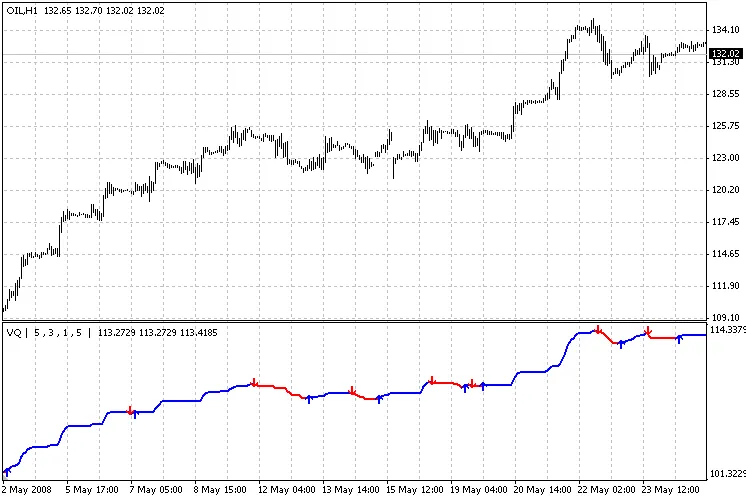
This Volatility Quality EA is designed to help you pinpoint major trends using the Volatility Quality Index developed by raff1410. It provides clear buy and sell signals, represented by arrows, along with easy-to-interpret up/down trend indicators shown as green and red lines. To get started, simply place the VQ.mq4 file in your "indicators" directory and the VQ_EA.mq4 in your "experts" directory. This EA works best with major currency pairs, X/JPY, and Oil on the H1 and H4 timeframes.
Image:
Tip: Always test your strategies on a demo account first!
Strategy Tester Report
VQ_EA
ODL-MT4 Demo (Build 216)
| Symbol | OIL (Brent Crude Oil) | ||||
| Period | 1 Hour (H1) 2008.05.01 00:00 - 2008.05.26 17:00 (2008.05.01 - 2008.05.30) | ||||
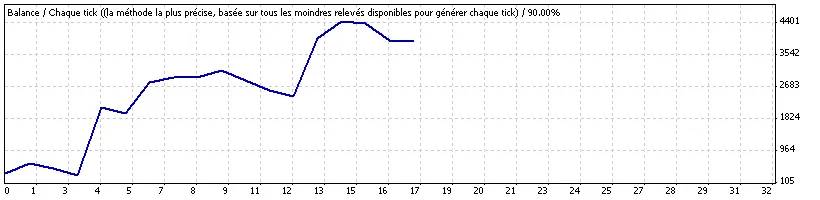
| Model | Every tick (most accurate method based on all available price data) | ||||
| Parameters | Lots=0.2; StopLoss=0; TakeProfit=0; TradeAtCloseBar=true; TrailingStop=0; TrailingStep=1; BreakEven=0; MagicNumber=0; Repeat=3; Periods=5; UseAlert=false; SendEmail=true; TradeLog="VQ_EA"; Slippage=3; Indicator_Setting="---------- Indicator Setting"; Crash=false; TimeFrame=0; Length=5; Method=3; Smoothing=1; Filter=5; RealTime=true; Steady=false; Color=true; Alerts=true; EmailON=false; SignalPrice=true; SignalPriceBUY=Yellow; SignalPriceSELL=Aqua; CountBars=1485; | ||||
| Bars in Test | 1376 | Ticks Modeled | 211185 | Model Quality | 90.00% |
| Chart Errors | 0 | ||||
| Initial Deposit | 350.00 | ||||
| Total Net Profit | 3566.00 | Gross Profit | 5278.00 | Gross Loss | -1712.00 |
| Profit Factor | 3.08 | Expected Payoff | 209.76 | ||
| Absolute Drawdown | 62.00 | Maximal Drawdown (%) | 1244.00 (35.83%) | Relative Drawdown | 72.73% (768.00) |
| Total Trades | 17 | Winning SHORT Positions % | 8 (25.00%) | Winning LONG Positions % | 9 (55.56%) |
| Winning Trades (% of Total) | 7 (41.18%) | Losing Trades (% of Total) | 10 (58.82%) | ||
| Largest | Gain per Trade | 1828.00 | Loss per Trade | -442.00 | |
| Average | Gain per Trade | 754.00 | Loss per Trade | -171.20 | |
| Maximum | Consecutive Gains (Profit in $) | 2 (2024.00) | Consecutive Losses (Loss in $) | 3 (-694.00) | |
| Maximal | Consecutive Wins | 2024.00 (2) | Consecutive Losses | -694.00 (3) | |
| Average | Consecutive Gains | 1 | Consecutive Losses | 2 | |
| # | Execution Date | Transaction | Order | Volume | Price | S/L (Stop Loss) | T/P (Take Profit) | Profit | Balance |
| 1 | 2008.05.01 08:00 | sell | 1 | 0.20 | 111.98 | 0.00 | 0.00 | ||
| 2 | 2008.05.01 19:00 | close | 1 | 0.20 | 110.59 | 0.00 | 0.00 | 278.00 | 628.00 |
| 3 | 2008.05.01 19:00 | buy | 2 | 0.20 | 110.60 | 0.00 | 0.00 | ||
| 4 | 2008.05.02 01:00 | close | 2 | 0.20 | 109.94 | 0.00 | 0.00 | -132.00 | 496.00 |
| 5 | 2008.05.02 01:01 | sell | 3 | 0.20 | 109.89 | 0.00 | 0.00 | ||
| 6 | 2008.05.02 09:00 | close | 3 | 0.20 | 110.81 | 0.00 | 0.00 | -184.00 | 312.00 |
| 7 | 2008.05.02 09:00 | buy | 4 | 0.20 | 110.82 | 0.00 | 0.00 | ||
| 8 | 2008.05.07 06:00 | close | 4 | 0.20 | 119.96 | 0.00 | 0.00 | 1828.00 | 2140.00 |
| 9 | 2008.05.07 06:00 | sell | 5 | 0.20 | 119.92 | 0.00 | 0.00 | ||
| 10 | 2008.05.07 08:00 | close | 5 | 0.20 | 120.73 | 0.00 | 0.00 | -162.00 | 1978.00 |
| 11 | 2008.05.07 08:00 | buy | 6 | 0.20 | 120.74 | 0.00 | 0.00 | ||
| 12 | 2008.05.12 03:00 | close | 6 | 0.20 | 124.81 | 0.00 | 0.00 | 814.00 | 2792.00 |
| 13 | 2008.05.13 08:00 | buy | 7 | 0.20 | 122.75 | 0.00 | 0.00 | ||
| 14 | 2008.05.14 08:00 | close | 7 | 0.20 | 123.54 | 0.00 | 0.00 | 158.00 | 2950.00 |
| 15 | 2008.05.14 08:00 | sell | 8 | 0.20 | 123.56 | 0.00 | 0.00 | ||
| 16 | 2008.05.15 09:00 | close | 8 | 0.20 | 123.62 | 0.00 | 0.00 | -12.00 | 2938.00 |
| 17 | 2008.05.15 09:00 | buy | 9 | 0.20 | 123.61 | 0.00 | 0.00 | ||
| 18 | 2008.05.16 17:00 | close | 9 | 0.20 | 124.49 | 0.00 | 0.00 | 176.00 | 3114.00 |
| 19 | 2008.05.16 17:00 | sell | 10 | 0.20 | 124.47 | 0.00 | 0.00 | ||
| 20 | 2008.05.19 12:00 | close | 10 | 0.20 | 125.82 | 0.00 | 0.00 | -270.00 | 2844.00 |
| 21 | 2008.05.19 12:00 | buy | 11 | 0.20 | 125.83 | 0.00 | 0.00 | ||
| 22 | 2008.05.19 16:00 | close | 11 | 0.20 | 124.57 | 0.00 | 0.00 | -252.00 | 2592.00 |
| 23 | 2008.05.19 16:00 | sell | 12 | 0.20 | 124.58 | 0.00 | 0.00 | ||
| 24 | 2008.05.19 21:01 | close | 12 | 0.20 | 125.44 | 0.00 | 0.00 | -172.00 | 2420.00 |
| 25 | 2008.05.19 21:01 | buy | 13 | 0.20 | 125.45 | 0.00 | 0.00 | ||
| 26 | 2008.05.22 13:00 | close | 13 | 0.20 | 133.29 | 0.00 | 0.00 | 1568.00 | 3988.00 |
| 27 | 2008.05.22 13:00 | sell | 14 | 0.20 | 133.30 | 0.00 | 0.00 | ||
| 28 | 2008.05.23 02:00 | close | 14 | 0.20 | 131.02 | 0.00 | 0.00 | 456.00 | 4444.00 |
| 29 | 2008.05.23 02:00 | buy | 15 | 0.20 | 131.01 | 0.00 | 0.00 | ||
| 30 | 2008.05.23 16:00 | close | 15 | 0.20 | 130.70 | 0.00 | 0.00 | -62.00 | 4382.00 |
| 31 | 2008.05.23 16:00 | sell | 16 | 0.20 | 130.68 | 0.00 | 0.00 | ||
| 32 | 2008.05.26 10:00 | close | 16 | 0.20 | 132.89 | 0.00 | 0.00 | -442.00 | 3940.00 |
| 33 | 2008.05.26 10:00 | buy | 17 | 0.20 | 132.86 | 0.00 | 0.00 | ||
| 34 | 2008.05.26 17:29 | close at stop | 17 | 0.20 | 132.74 | 0.00 | 0.00 | -24.00 | 3916.00 |


Comments 0