Author: Watasi
Ever wondered how trends shift in the market? Or how to spot a flat market? Well, the TrendLinearReg indicator is here to help you tackle these questions!
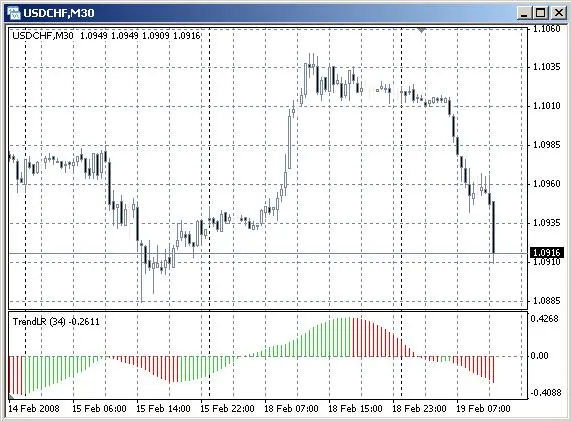
This indicator operates on the premise that the trend over a set number of bars can be represented as a straight line. You might recall from school that the equation for a straight line is y = bx + c. Here, the slope of the line is denoted by the b coefficient, which essentially represents the tangent of the angle of inclination. What this indicator does is compute this parameter through linear regression for each bar and showcase it in a dedicated window. When the line is green, it indicates that the value has increased compared to the previous one, meaning the slope angle is rising. On the flip side, a red line signifies a decrease.
In reality, the b coefficient in our charts is influenced by two components: the tangent of the line's angle and a coefficient that pertains to the currency pair (often referred to as Point). This means that the scale of the indicator varies across different currency pairs.
How to Utilize the TrendLinearReg Indicator
There are several strategies for using this indicator effectively:
- Crossing the Zero Line: Pay attention when the indicator crosses above or below the zero line as it can signal a trend change.
- Maximum Value Passage: Watch for points where the indicator hits its maximum value, as this can indicate potential market reversals.
- Identifying Flat Markets: If you notice the indicator hovering near the zero line, it suggests a flat market. You can look to trade on a breakout from this zone.
If you have any ideas on how to enhance this indicator or alternative ways to utilize it, I’d love to hear your thoughts!


Comments 0