Let’s dive into the latest updates on the Renko Time and Time Between Candles indicator for MetaTrader 4!
What’s New?
- *Version 2 has improved array alignment and calculation for the current bar time.
- *Version 2ma now includes a moving average, thanks to your requests!
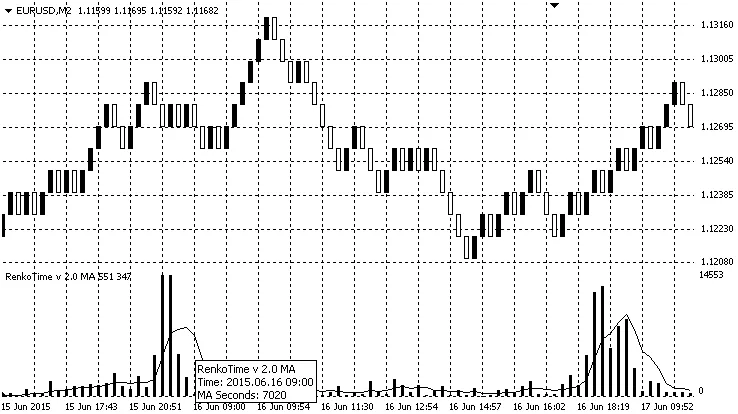
This handy indicator is designed to show the time difference between candles in seconds, making it perfect for offline Renko charts. It lets you see how long each block or brick takes to form, giving you deeper insights into market behavior.
On a regular timeframe chart, this tool can also help you spot dropped candles, especially if the next candle starts later than expected.

When the market closes, you might notice longer indicator bars at the period separator. This can be a sign that market activity has slowed down, as longer bars typically indicate indecision while smaller bars suggest quick movements.

If we look at a regular timeframe chart, the indicator can reveal skipped candles—something that happens surprisingly often, especially around news releases. For example, if news breaks at 15:30 and the following candle is skipped, you’ll see the next one starting at 15:31 taking a full 120 seconds to appear, counting from the previous candle's start time.
Thoughts from the Community:
It might seem strange to incorporate time into Renko charts, but this feature can provide valuable insights, like indicating potential market reversals or slow price action within a range. Conversely, rapidly forming bricks can indicate a genuine price movement.
Remember, on a standard timeframe chart, this tool can show you when your broker has skipped one or more candles. It's a common occurrence, particularly during high-impact news events!
Check out the added moving average:
Feel free to share your feedback and experiences! Your comments are what keep this community thriving.


Comments 0