Hey there, fellow traders! If you’re diving into the world of technical analysis, you’ve probably come across the ADX indicator. But let me introduce you to a game-changer: the ADXm indicator for MetaTrader 4. Unlike the traditional ADX, which can sometimes leave you scratching your head when it comes to trend direction, the ADXm gives you a clearer view.
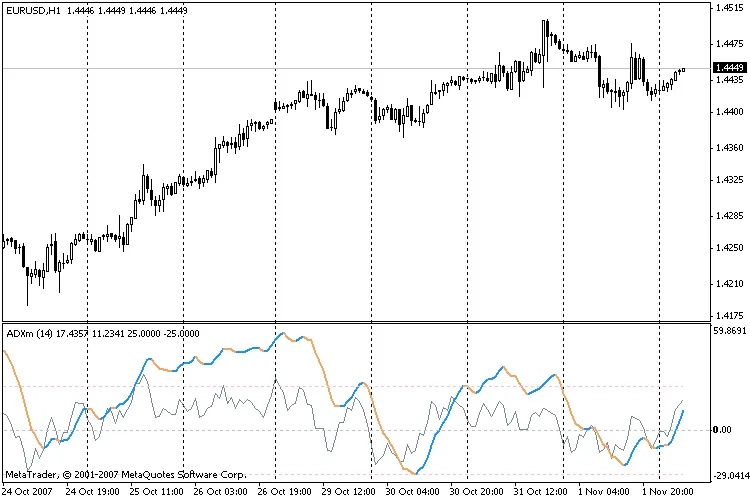
This nifty indicator doesn’t just plot the ADX values in absolute units; it allows you to visualize the positive and negative ADX half-waves in color. It’s super handy for spotting trends at a glance! Plus, the DI+ and DI- signals are shown as their differences (in gray), helping you make more informed trading decisions.
Using the ADXm is pretty straightforward; it follows the same principles as the classic ADX. It also highlights critical trend levels with dashed lines. Typically, the market is considered to be trending when it’s above a level of around 20-25 percent, but keep in mind that this can vary depending on your chosen time frame.
Setting Up the ADXm Indicator
When you’re ready to get started, here’s what you need to know about the settings:
- p: This is the ADX period you’ll be using.
- Level: This is your critical level where you can determine if the market is trending.
So, there you have it! The ADXm indicator could be just the tool you need to enhance your trading strategy. Give it a try and see how it can help you identify trends more effectively.


Comments 0