Hey there, fellow traders! If you're diving into the Boom Index arena, you’ll want to get the hang of the Spike Pattern, especially when using MetaTrader 5. Let’s break it down!
Bullish Spike Pattern Detection
This pattern is a classic 3-bar setup:
1st candle: A solid green candle with a large body (this is your bullish spike).
2nd candle: A red candle indicating a pullback.
3rd candle: Another green candle with a large body, confirming the bullish spike.
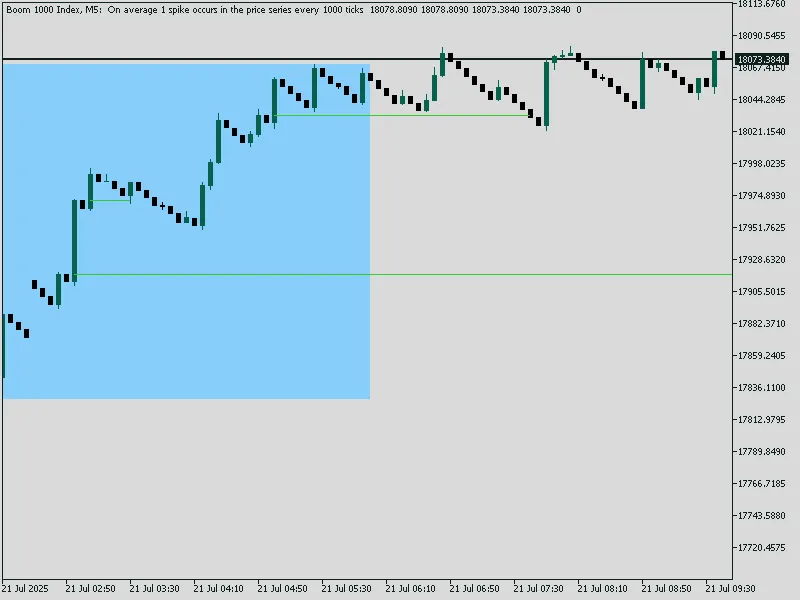
When this setup appears, it creates a zone.
Zone Creation
A blue rectangle is drawn covering the high and low of the 3 candles.
A lime green horizontal entry line is placed at the open price of the middle (2nd) candle.
This line extends well into the future until the price returns.
Inputs Explained
mq5
input color BoxColor = clrBlue;  // Color of the 3-candle pattern box
input color EntryLineColor = clrLime;  // Color of the entry line
input ENUM_LINE_STYLE EntryLineStyle = STYLE_SOLID;  // Style of the entry line
input int BoxWidth = 2;  // Width of box border
input int EntryLineWidth = 2;  // Width of entry line
input int EntryLineLength = 200;  // How far the entry line extends
These inputs give you complete control over the appearance of the box and entry line.
Core Idea
We’re on the lookout for a 3-candle bullish pattern:
1. First candle – a strong bullish spike
2. Second candle – a bearish retracement
3. Third candle – another strong bullish spike
Once this pattern is spotted, we draw:
- A box around the pattern
- A horizontal line at the open of the 2nd candle (entry point)
When the price returns to that line (we call this


Comments 0