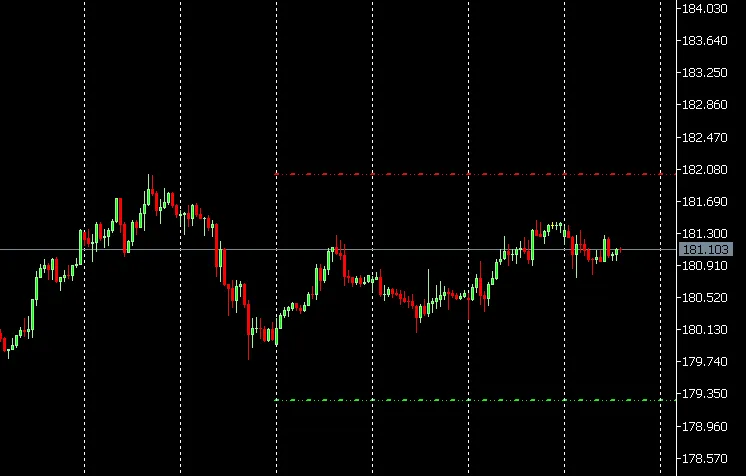
If you're looking to enhance your trading game, understanding the Previous Week High and Low can be a game changer. This handy indicator displays two horizontal lines: one for the Previous Week High (in your chosen color) and another for the Previous Week Low (in your chosen color).
These levels are essential for:
- Breakout or Rejection Trading: Knowing these levels can help you identify potential breakouts or reversals.
- Weekly Range Analysis: They serve as a benchmark for analyzing the weekly price range.
- Institutional Level Tracking: These levels often align with liquidity zones where institutional traders operate.
This indicator auto-fetches the previous week's high and low, drawing them as horizontal lines that cover the current week. It updates every minute and removes itself cleanly when you exit.
Here's how it works:
It deletes the old line (if there was one).
It creates a new OBJ_TREND object with both points set at the same price, making it perfectly horizontal.
It applies all visual settings:
Color
Width
Style
Non-selectable
Background mode


Comments 0