What is Spearman's Rank Correlation?
Spearman's Rank Correlation is a handy tool for traders looking to analyze the relationship between two variables. This statistical method helps us understand how closely two numeric sequences move in relation to each other.
How to Calculate Spearman's Rank Correlation
Calculating this correlation involves a few straightforward steps:
- Step 1: Assign a rank to each observation, sorting them from highest to lowest (or vice versa).
- Step 2: For each pair of values, subtract the ranks of one set from the other.
- Step 3: Square each difference and sum these squared values.
- Step 4: Use the formula below to find the rank correlation:

Where  is the sum of the squares of rank differences, and
  is the number of paired observations.
Interpreting Spearman's Rank Correlation
When using rank correlation, we can categorize the strength of the correlation:
- Values ≤ 0.3: Low correlation
- Values between 0.4 and 0.7: Moderate correlation
- Values > 0.7: High correlation
Keep in mind that while Spearman's Rank Correlation is useful, it is slightly less powerful than parametric correlation methods.
When to Use Spearman's Rank Correlation
This method shines when you have a limited number of observations. It works well with both numerical data and data categorized by various attributes. You can explore more about this method here.
How it Compares to Other Indicators
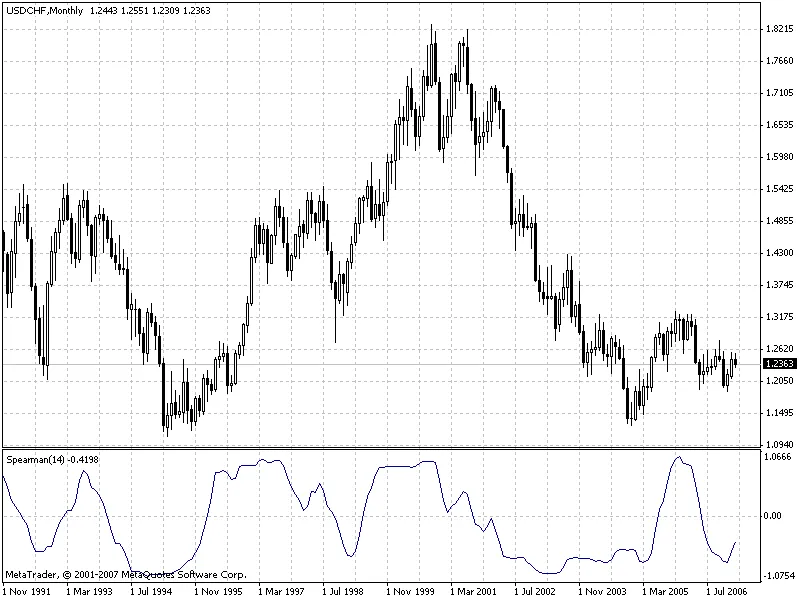
Spearman's Rank Correlation is also considered an oscillator, but it tends to be smoother than the stochastic oscillator, providing a clearer view without lagging at pivot points.
Key Parameters for Calculation
The primary external parameter affecting the calculation is rangeN. This sets the number of bars over which we're identifying patterns. For instance, if rangeN is set to 14, we examine the closing price sequence Close[i], Close[i+1], ... Close[i+rangeN-1] to create a rank sequence based on these prices.
The direction parameter indicates whether to sort from highest to lowest (true) or from lowest to highest (false). Setting it to true gives you a standard view, while false produces an inverted perspective. Additionally, the CalculatedBars parameter limits the number of bars in calculations to optimize CPU usage, although setting it to zero means calculations will use all available historical data.
The Maxrange parameter, capped at 30, sets a maximum calculation period, which helps in resource management.


Comments 0