As traders, we’re always on the lookout for tools that can help us make sense of market movements. One such tool is the ZigZag indicator, which highlights significant price swings. Let’s break down what the lines mean.
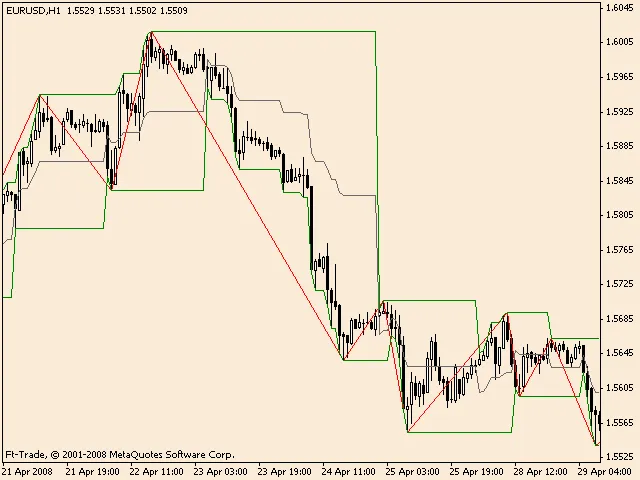
Green Lines: These represent the Highs and Lows indicated by the ZigZag. They help you visualize price peaks and troughs, making it easier to identify trends.
Gray Line: This line marks the midpoint of the most recent swing. It can give you an idea of potential price retracements or reversals.
Incorporating the ZigZag indicator into your trading strategy can provide clarity during volatile market conditions. Keep an eye on those highs and lows!


Comments 0