Key Features
Dynamic and Coloured Histogram:
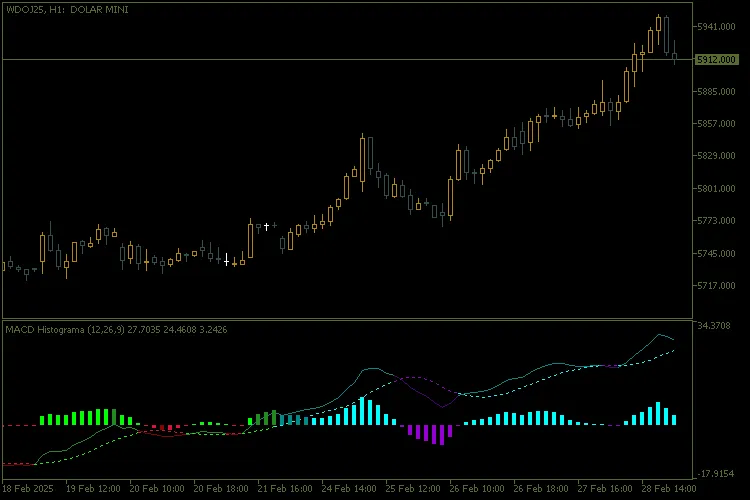
The histogram automatically changes colour based on market conditions, giving you quick insights at a glance:- When the MACD crosses above or below the signal line.
- When the MACD crosses above or below the zero line.
- The strength and direction of the trend.
Customisable Sound Alerts:
Get real-time notifications whenever significant crossings occur between the MACD and the signal line, or when the MACD crosses the zero line. You can tailor:- The sound of the alert.
- The maximum number of repetitions.
- The minimum pause between alerts.
Configurable Colors:
This indicator employs a vibrant and intuitive colour palette to highlight various states of the MACD, signal line, and histogram. These colours are designed for easy interpretation, helping you make quick decisions.Customisable Parameters:
- Periods of the fast and slow moving averages.
- Period of the signal moving average.
- Price applied to the calculation (close, open, high, low, etc.).
User-Friendly Interface:
The indicator is straightforward to set up and use, even if you're just starting out. All parameters can be adjusted right in the properties window.
How It Works:
- The indicator calculates the difference between the MACD and its signal line, displaying the result as a coloured histogram.
- Different colours represent crossovers, positive/negative trends, and momentum shifts.
- Audible alerts are triggered for significant events, such as line crossings or transitions between positive and negative zones.
Benefits:
- Quick Decision Making: With dynamic colours and sound alerts, you can react swiftly to market changes.
- Full Customisation: Tailor the parameters to align with your trading strategy.
- Clear Visualisation: The clean and intuitive design makes it easy to interpret data, even on busy charts.
- Compatibility: Works seamlessly on any asset and timeframe supported by MetaTrader 5.
Examples of Use:
- Utilise the indicator to pinpoint entry and exit points in trend strategies.
- Combine the MACD Colour Histogram with other indicators to validate buy/sell signals.
- Keep an eye on the histogram to spot divergences between price and momentum.
For a detailed view: View Chart


Comments 0