What is CustomCandle?
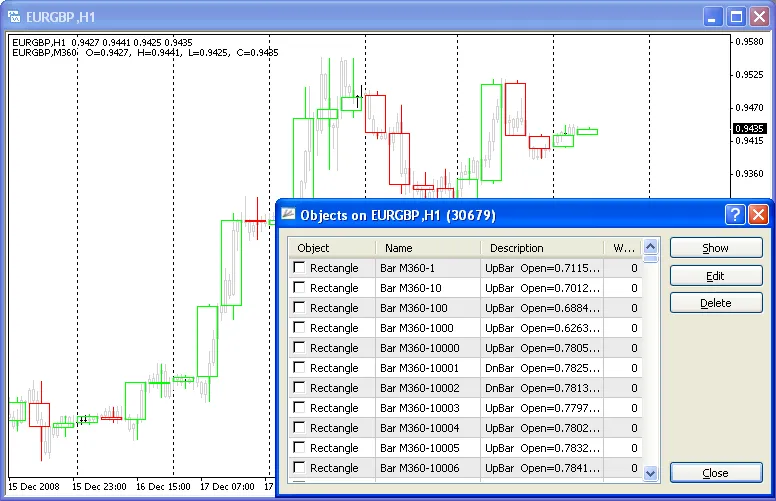
CustomCandle is a nifty tool that allows you to draw candlesticks from a larger, possibly non-standard timeframe right on your current chart. The best part? You don't need to switch to that larger timeframe to see the data. Instead, it pulls in the relevant information while keeping your current view intact. Just remember to fade or hide the candlesticks (bars) from your current chart for a cleaner look!
Limitations to Keep in Mind
- Larger Timeframe Must Be a Multiple: The period of your larger timeframe needs to be a multiple of your current one. For example, if you're on M5, you can use M10, M15, M20, etc., up to 1440 minutes. But if you're working with M1, any timeframe from 2 to 1440 will do.
- Day Limit: Your larger timeframe can't exceed one day (1440 minutes). Drawing 2-day candlesticks is a no-go. I could program that feature, but I opted not to.
- H4 and Larger Timeframes: Unfortunately, charts with timeframes of H4 and above aren't supported. I could program something for that in the future, though.
Special Features
One thing to watch out for is that after a disconnection, some unwanted candlesticks might pop up during history loading, and the numbering can get a bit messy. If this happens, simply redraw the candlesticks after the history update. No need to remove the indicator; just dive into its properties. It’s a bit of a nuisance, but I'm still on the hunt for a permanent fix.


Comments 0