Switching between different periods and indicator parameters can often feel like a time-consuming task, especially when you're trying to get a handle on their behavior and really grasp the underlying dynamics of the indicators.
The RSI and DeMarker indicators were developed in a landscape already filled with various standard indicators, each with their own set of parameters.
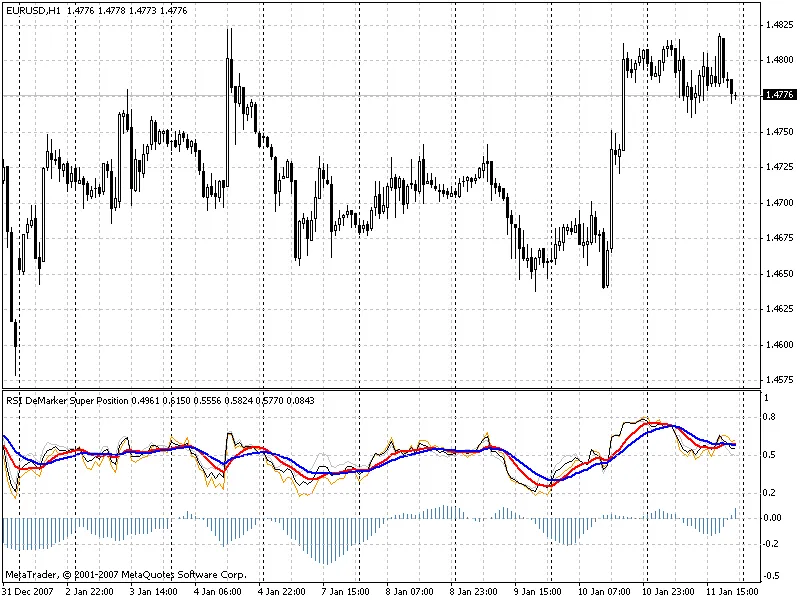
Here's what this setup calculates:
- Four RSI lines, each with different periods (the period change step can be adjusted in the indicator settings), create a weighted average based on the RSI;
- Four DeMarker lines, also with varying periods (period change steps are adjustable), form a weighted average based on the DeMarker;
- Due to the differing dimensions of RSI and DeMarker, the average values are normalized to a common display format;
- The moving averages for both RSI and DeMarker generate a superposition of the two indicators;
- To make interpretation easier, two moving average lines are added to the superposition line;
- For enhanced visualization, a histogram illustrating the difference between the weighted averages of RSI and DeMarker is displayed.
The end result? One comprehensive indicator that integrates two values from different periods and showcases different dynamics.
It's important to note that RSI and DeMarker don't just react differently to various market conditions on the chart, but they also respond uniquely to their own indicator periods. Understanding this difference can be incredibly beneficial.
Additionally, you can choose to smooth out the superposition line for clearer insights.


Comments 0