Hey fellow traders,
Are you on the hunt for the perfect moment to place your trades? Finding those range bound periods can be a game changer. I’ve been digging into this myself and created an indicator called RangeBoundMA, designed to help pinpoint these crucial market phases.
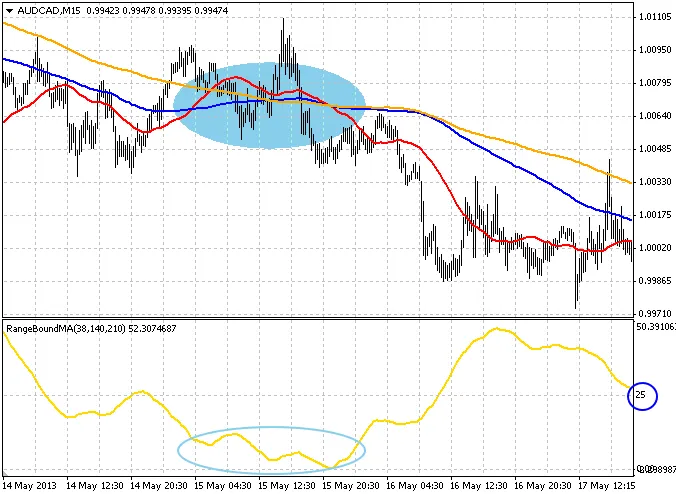
Here’s how it works: the RangeBoundMA indicator analyzes the price movements across three Simple Moving Averages (SMAs) set at periods of 38, 140, and 210. When you attach it to your chart, you’ll notice a horizontal line at the 25 mark. If the indicator dips below this line, it signals that prices are in a range bound phase.
Now, here’s where it gets interesting. When the price breaks above the highest point or below the lowest point during this range bound period, it’s typically the right moment to pull the trigger on your trade. Timing is everything, right?
However, I’ve hit a snag while coding an Expert Advisor (EA) to automate this process. Being relatively new to MQL4 programming, I’ve encountered some issues. If anyone could lend a hand in reviewing my code, I’d be incredibly grateful! What might I be doing wrong? Any insights would be greatly appreciated.


Comments 0