If you're looking to boost your trading game, you might want to check out the Altarius RSI & Stochastic EA. This Expert Advisor combines the power of the RSI (Relative Strength Index) and Stochastic indicators to give you a solid edge in the market. While the results can be impressive, it's worth noting that the performance can fluctuate over time—so don’t get too comfortable!
Let's dive into the details with a look at the strategy tester report:
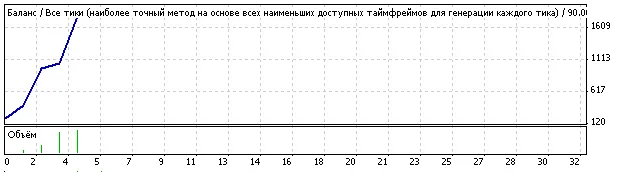
Strategy Tester Report
Version 6
Alpari-Demo (Build 217)
| Symbol | EURUSD (Euro vs US Dollar) | ||||
| Period | 30 Minutes (M30) from 2008.07.01 00:00 to 2008.08.07 23:30 | ||||
| Model | Every tick (the most precise method based on all available timeframes) | ||||
| Parameters | Lots=1; MaximumRisk=0.8; DecreaseFactor=3; PeriodRSI=6; | ||||
| Bars in test | 2,335 | Ticks modelled | 250,834 | Modelling quality | 90.00% |
| Missmatched charts errors | 92 | ||||
| Initial deposit | £200.00 | ||||
| Total net profit | £1,591.38 | Gross profit | £1,591.38 | Gross loss | £0.00 |
| Profit factor | — | Expected payoff | £397.84 | ||
| Absolute drawdown | £43.20 | Maximal drawdown | £535.50 (35.19%) | Relative drawdown | 43.52% (134.40) |
| Total trades | 4 | Short positions (% won) | 2 (100.00%) | Long positions (% won) | 2 (100.00%) |
| Profit trades (% of total) | 4 (100.00%) | Loss trades (% of total) | 0 (0.00%) | ||
| Largest | profit trade | £728.45 | loss trade | £0.00 | |
| Average | profit trade | £397.84 | loss trade | £0.00 | |
| Maximum | consecutive wins (profit in money) | 4 (£1,591.38) | consecutive losses (loss in money) | 0 (£0.00) | |
| Maximum | consecutive profit (count of wins) | £1,591.38 (4) | consecutive loss (count of losses) | 0.00 (0) | |
| Average | consecutive wins | 4 | consecutive losses | 0 | |
| № | Time | Type | Order | Volume | Price | S / L | T / P | Profit | Balance |
| 1 | 2008.07.01 01:00 | buy | 1 | 0.16 | 1.5750 | 0.0000 | 0.0000 | ||
| 2 | 2008.07.02 22:00 | close | 1 | 0.16 | 1.5878 | 0.0000 | 0.0000 | £205.26 | £405.26 |
| 3 | 2008.07.03 01:00 | sell | 2 | 0.32 | 1.5876 | 0.0000 | 0.0000 | ||
| 4 | 2008.07.03 22:30 | close | 2 | 0.32 | 1.5698 | 0.0000 | 0.0000 | £569.60 | £974.86 |
| 5 | 2008.07.03 23:00 | buy | 3 | 0.78 | 1.5706 | 0.0000 | 0.0000 | ||
| 6 | 2008.07.04 10:00 | close | 3 | 0.78 | 1.5717 | 0.0000 | 0.0000 | £88.06 | £1,062.93 |
| 7 | 2008.07.04 10:30 | sell | 4 | 0.85 | 1.5711 | 0.0000 | 0.0000 | ||
| 8 | 2008.07.07 10:00 | close | 4 | 0.85 | 1.5624 | 0.0000 | 0.0000 | £728.45 | £1,791.38 |


Comments 0