Hey there, fellow traders! Today, I want to introduce you to a nifty little indicator that can make a significant difference in your trading game: the Automatic Parabolic Support and Resistance Levels indicator for MetaTrader 4.
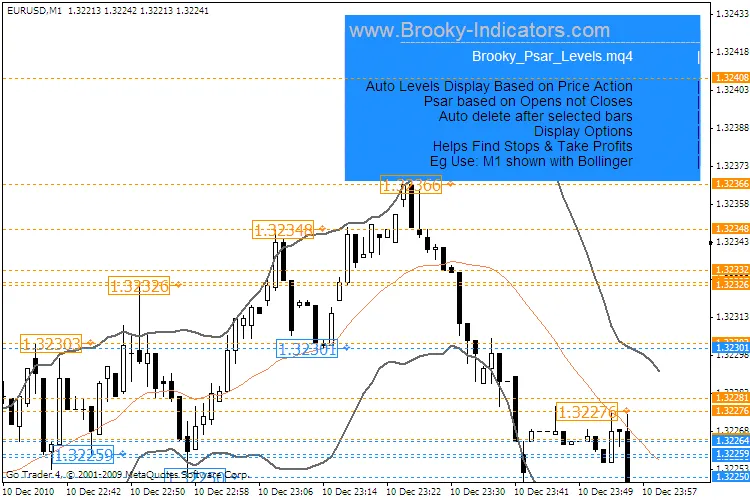
This handy tool automatically draws support and resistance levels on your charts, and it even clears out older levels based on your selected number of bars. What’s unique about this indicator is that it calculates turns based on opens rather than closes. This approach tends to capture more price reversals, which sets it apart from other indicators.
To help you see this indicator in action, I’ve put together a video demonstrating how it works, especially when paired with Bollinger Bands. It really shows the indicator's potential! Feel free to check it out here: Parabolic S&R Levels Video.
In simple terms, the strength of the support and resistance levels is indicated by how closely the previous crosses are packed together on the chart. From my experience, price tends to break into clear areas, making it easier for us to spot opportunities.
So, if you’re looking to enhance your trading strategy, give this indicator a try. It might just be the edge you’ve been searching for!


Comments 0