Hey fellow traders! Today, let's dive into a fascinating concept that can enhance your trading strategy: plotting channels using the least squares method.
When we draw a line in the form of y = ax + b through a collection of data points, we're essentially balancing the distance from each point to the line. This is a powerful way to visualize market trends!
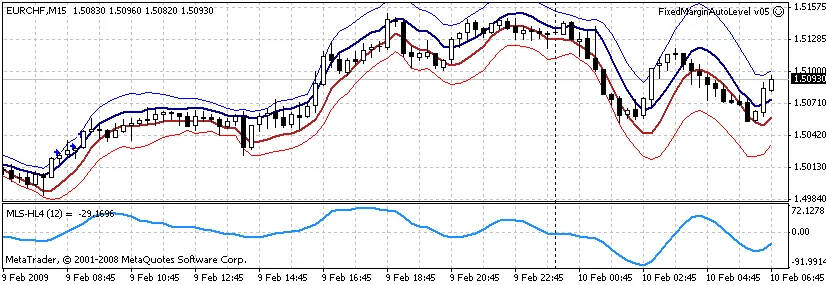
To create the HighLine and LowLine, we utilize the highest and lowest points over a specified period, which we’ll refer to as MyPeriod.
If you have the CalculateDeflection parameter turned on, the chart will include two additional lines: HighDeflection and LowDeflection. These lines illustrate potential price variability, represented by the mean square error. You'll also spot a hidden line designated as b, which indicates the free variable in the line equation.
The MLS-HL4-Angle indicator takes things a step further by calculating the value of a in points. It shows the inclination angle of the line in relation to the horizon. If the angle p is greater than 0, the curve a leans to the left, indicating a positive angle. Conversely, if p is less than 0, the curve tilts right, resulting in a negative angle.
For those interested in the technical side, the MLS.zip archive provides all the calculations using the least squares method.


Comments 0