Hey traders! Today, let’s dive into the world of Historical Volatility (HV). It’s a handy tool that measures how much a security or market index fluctuates over a specific period. Essentially, HV tells us how far prices have strayed from their average. While the standard deviation is the most common method to calculate HV, there are other ways to get the job done too.
Now, here’s the kicker: a higher HV value means more risk. But don’t let that scare you! Risk can work in your favor, whether you’re looking to go long or short. Just keep in mind that Historical Volatility isn’t a directional indicator. In simpler terms, it doesn’t tell you whether prices are going up or down; it just shows how much they’re bouncing around!
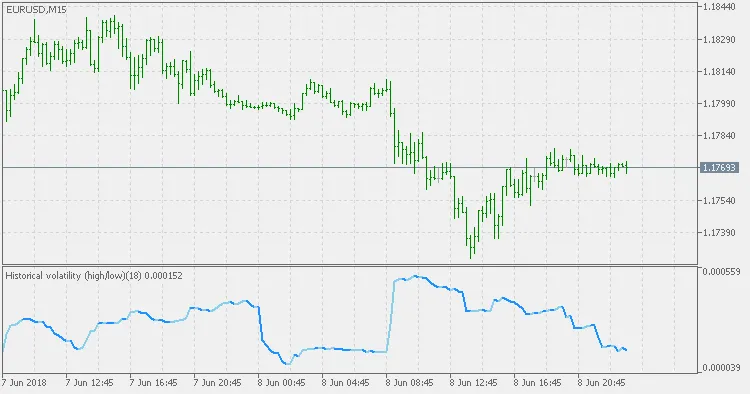
This particular version of the HV indicator takes a different approach by using the High/Low ratio rather than relying solely on close prices. This sets it apart from the traditional Historical Volatility indicator, giving you a fresh perspective on price movements.


Comments 0