Hey fellow traders!
Today, I want to dive into two essential indicators that can really help you navigate the markets: the Support-Resistance Indicator and the SR-Rate Indicator.
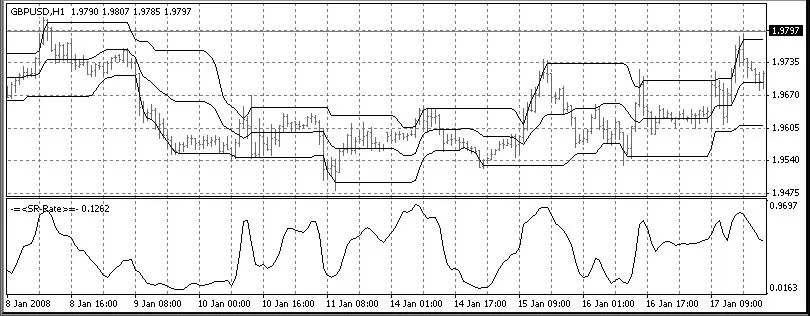
Support-Resistance Indicator
As the name suggests, the Support-Resistance Indicator is designed to pinpoint and display those crucial support and resistance levels on your charts.
The midline you see is essentially the average value between support and resistance, giving you a clearer picture of market dynamics.
You can customize the indicator's window width. For example, if you want to see daily levels on a one-hour chart, simply set the window width to 24.
SR-Rate Indicator
The SR-Rate Indicator highlights which side of the price range the market is leaning towards, helping you make more informed trading decisions.
Setup Instructions
- Make sure to place the OneSideGaussian file in your
librariesfolder. - Store the other two files in your
indicatorsfolder.
In my opinion, using these indicators together will give you the best results. They complement each other nicely and can enhance your trading strategy.
I apologize for the brief explanations, but I believe you can easily navigate through the 10 KB of code on your own. I’ve made an effort to write clearly, with variable names that reflect their purpose.
I’m really excited to hear your thoughts and feedback on this program, especially since this is my first contribution here. Let’s share ideas and grow together as traders!


Comments 0