The Detrended Synthetic Price (DSP) indicator has made quite a splash in the trading community, thanks to its original development by John Ehlers. While there are numerous ways to utilize this tool, the method that most traders seem to gravitate towards involves using fixed levels. However, this approach can be quite restrictive, requiring adjustments for every symbol, time frame, and parameter setting.
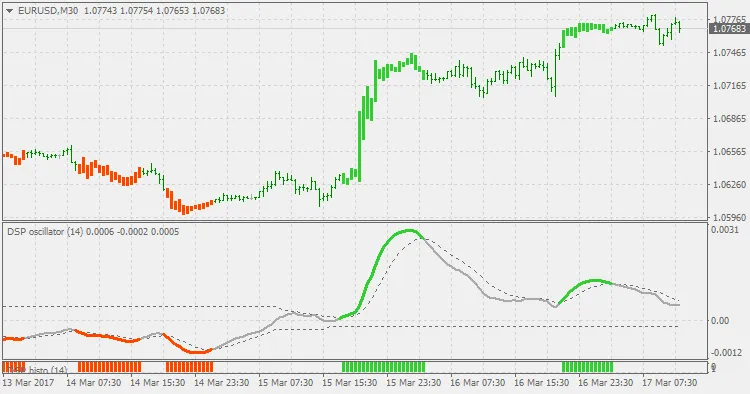
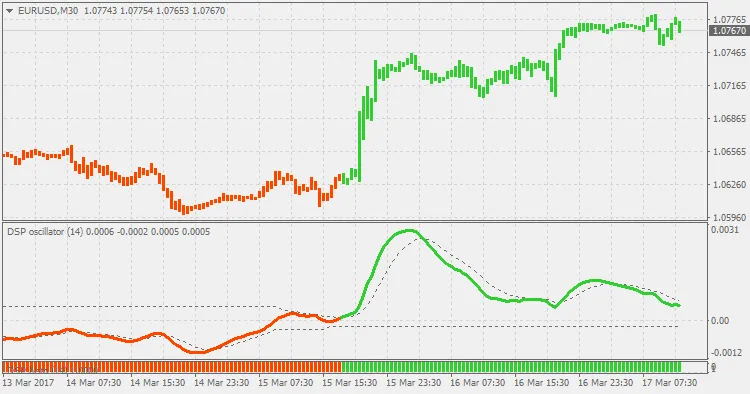
Instead, I recommend exploring the discontinued signal lines version. This variant offers a more flexible and user-friendly experience. It presents the data as colored bars on the main chart, making it easier to interpret compared to the traditional oscillator format. Below, you can see how the DSP compares in both formats, depending on your coloring settings:


Comments 0