The Price and Volume Trend (PVT) indicator is a powerful tool for traders, much like the On Balance Volume (OBV) indicator. PVT provides us with a cumulative sum of trade volumes, reflecting changes in closing prices.
So, how does it work? The calculation method is similar to OBV, but there’s a key difference. With OBV, when the closing price rises, we add the entire daily volume to the indicator, and when it falls, we subtract the full volume. In contrast, PVT only adds or subtracts a portion of the daily volume. This portion is determined based on how the current closing price compares to the previous day's close.
In OBV, the total cumulative volume for each period is added together. However, with PVT, we take the volume and multiply it by a coefficient that reflects the difference between the current close price and the previous close. This small tweak allows traders to get a clearer picture of market trends and sentiment.
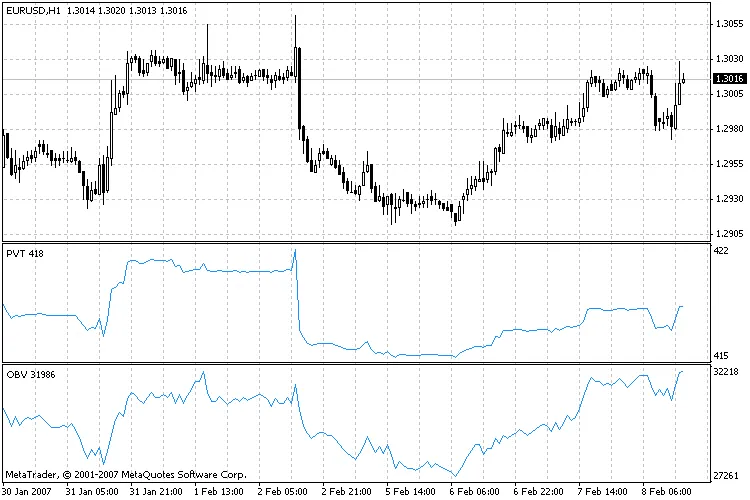
Take a look at the chart below to see how closely these two indicators correlate:
By understanding the PVT indicator, you can enhance your trading strategy and make more informed decisions based on the relationship between price movements and volume.


Comments 0