Hey fellow traders! Today, let's dive into the Stochastic RSI indicator—often referred to as Stoch RSI. If you’re familiar with technical analysis, you know that it's all about getting the edge in the market, and this indicator is a nifty tool to have in your trading arsenal.
So, what exactly is Stoch RSI? Simply put, it’s an indicator of an indicator. It takes the Relative Strength Index (RSI) and applies a stochastic calculation to it. Essentially, it measures the RSI relative to its own high and low range over a specified period. This gives you insight into whether the market is overbought or oversold.
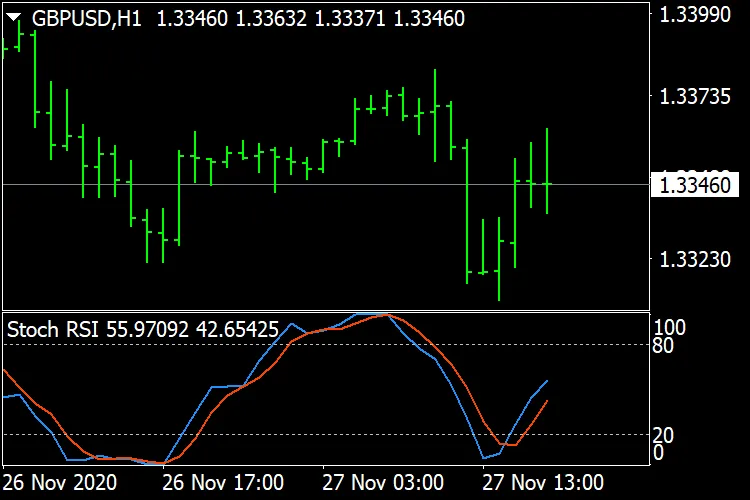
The Stochastic RSI is an oscillator, which means it generates a value between 0 and 1. The results are then plotted as a line on your chart, making it easy to spot potential trading opportunities. It’s a fantastic way to gauge momentum and can help you make informed decisions about when to enter or exit a trade.
In summary, if you're looking to enhance your trading strategy, incorporating the Stochastic RSI into your analysis can provide valuable insights into market conditions.


Comments 0