Hey fellow traders! Today, let’s dive into a fascinating tool that can help you predict future price movements: the Extrapolator Indicator. This nifty tool uses a variety of methods to generate its predictions, and you can choose the one that suits your trading style best. Let’s break it down!
Methods of Prediction
- Method 1: Fourier's Extrapolation - This method calculates frequencies using the Quinn-Fernandes Algorithm.
- Method 2: Autocorrelation Method.
- Method 3: Weighted Burg Method.
- Method 4: Burg Method with Helme-Nikias weighting function.
- Method 5: Itakura-Saito (geometric) method.
- Method 6: Modified Covariance Method.
Methods 2 through 6 utilize linear prediction techniques, which means they forecast future prices based on past price data. For instance, if we have a series of prices labeled as x[0] to x[n-1] (where the highest index represents the most recent price), the future price x[n] can be calculated with the formula:
x[n] = -Sum(a[i]*x[n-i], i=1..p)
In this formula, a[i=1..p] represents the model coefficients and p is the order of the model. The methods from 2 to 6 optimize these coefficients by minimizing the mean-root-square error over the last n-p bars of data. While we could theoretically achieve zero prediction error using the Levinson-Durbin method, it’s often unstable, which is why it’s not included here.
Input Parameters
- LastBar: Refers to the number of the last bar in the historical data.
- PastBars: This is the number of past bars utilized for forecasting future values.
- LPOrder: This indicates the order of the linear model as a fraction of the number of past bars (0 to 1).
- FutBars: The number of future bars for which predictions are made.
- HarmNo: The maximum number of frequencies for Method 1 (set to 0 to use all frequencies).
- FreqTOL: The acceptable imprecision in frequency calculations for Method 1 (values >0.001 may lead to convergence issues).
- BurgWin: This determines the weighting function for Method 2 (0 for Rectangular, 1 for Hamming, and 2 for Parabolic).
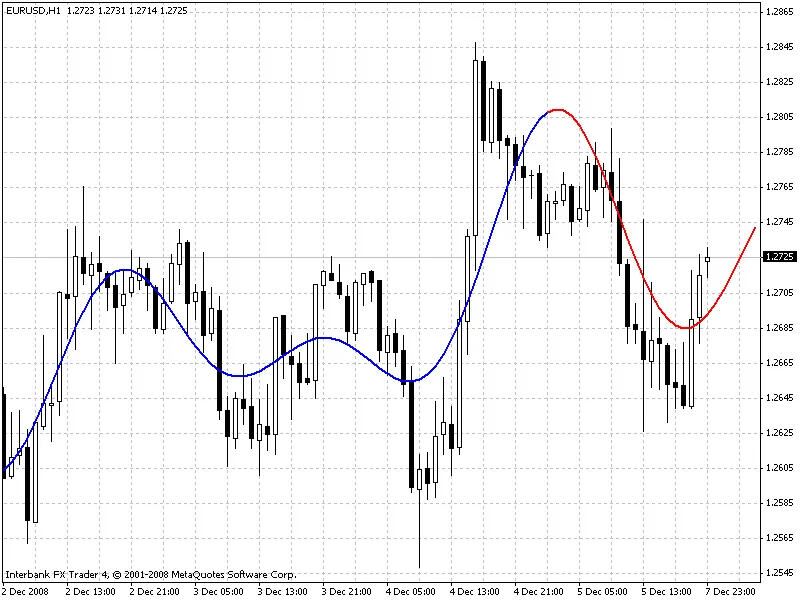
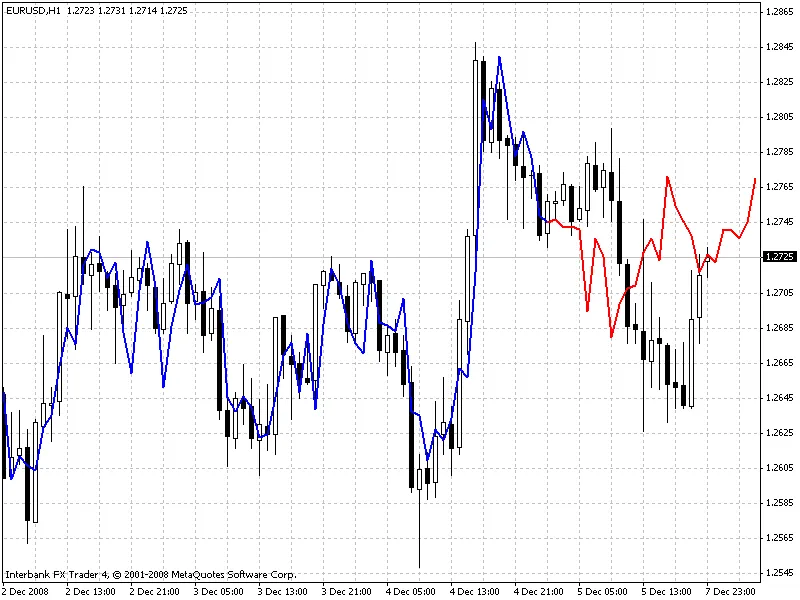
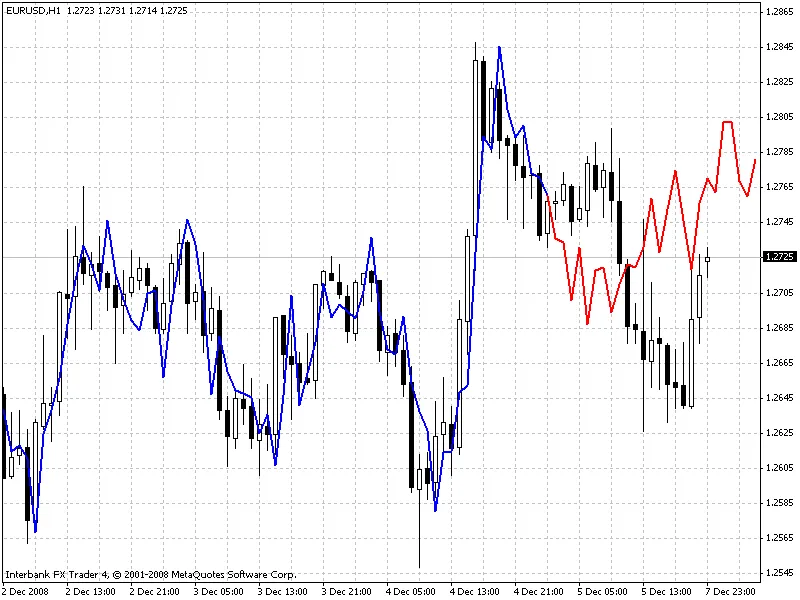
When you use the Extrapolator, it visually represents its predictions with two lines: the blue line tracks the modeled prices over the training bars, while the red line shows the predicted future prices. Below are some examples of the methods in action:
Visual Examples
Method 1 (Fourier Series Extrapolation)
Method 3 (Burg's Method)
Method 6 (Modified Covariance Method)
Call for Collaboration
If you successfully develop a profitable trading system based on this indicator, I’d love to hear your thoughts! Please share your insights via the email provided in the code.


Comments 0