The CheckMark pattern is an essential tool for traders looking to predict the next candle's movement—whether it's bullish or bearish. While it’s straightforward, it has its quirks and doesn't influence the market beyond that prediction.
To identify the CheckMark pattern, you'll need more than just a price chart. It’s similar to how you’d plot divergence lines. You’ll want to incorporate an additional indicator to get the best results, and oscillators are your best bet for this task.
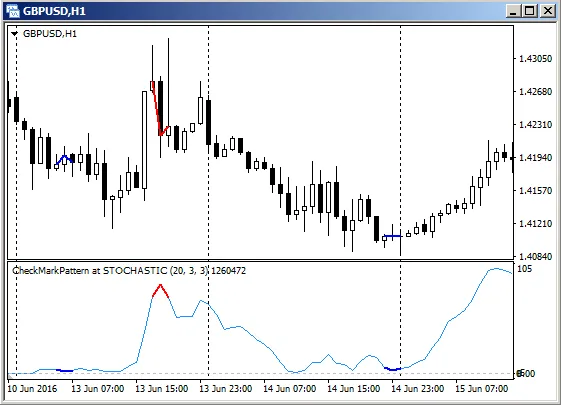
Here’s how it works: you’ll focus on the last three bars on your chart. By connecting the Close prices of these bars with lines, and highlighting the last three values on the oscillator chart, you can spot the CheckMark pattern. If you see checkmarks forming on both charts and their vertical orientations differ, congratulations—you’ve found the CheckMark pattern! A local minimum on the oscillator signals a bullish pattern (blue), while a local maximum indicates a bearish one (red).
If you want to dive deeper, check out the detailed article on The CheckMark Pattern.
Note: This content was updated on 26.08.2016. The latest version (1.10) now includes the option to use the CCI indicator as the base.


Comments 0