Hey fellow traders! Today, we're diving into the Pan PrizMA CD Phase Indicator, which is based on the PanPrizMA Sin leverage 72. This tool is designed to help you calculate both the phase and amplitude, which can be quite handy in your trading journey.
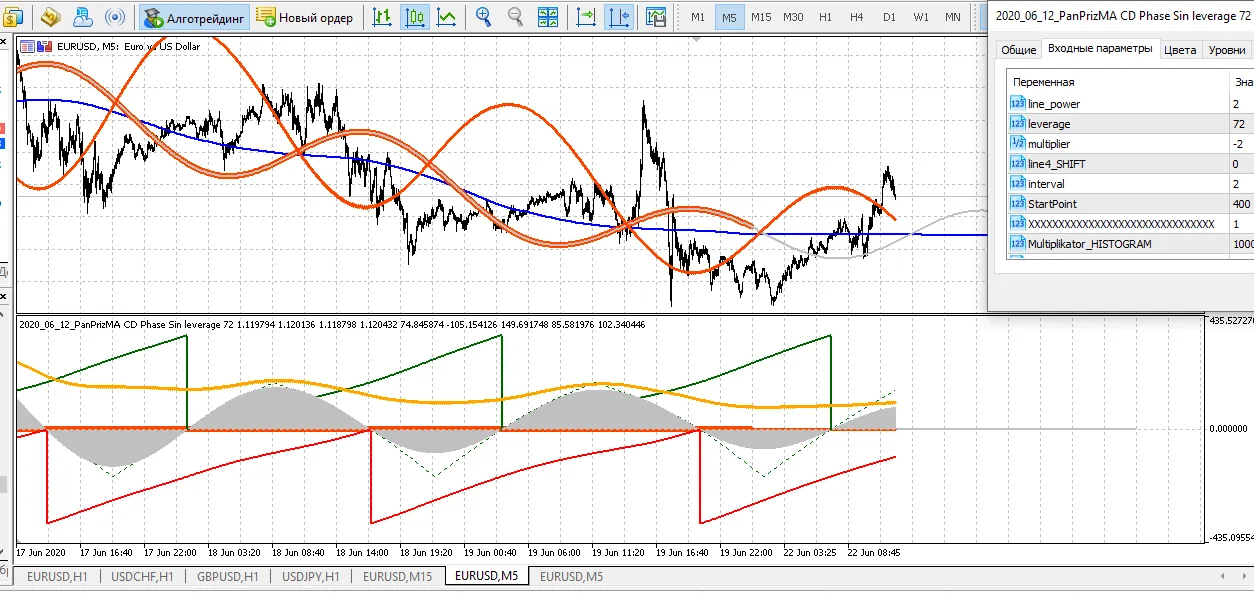
The phase is calculated in degrees, ranging from 0 to 360, and it’s represented by the green line (the 5th line in the array). On the flip side, the opposite phase is also calculated in degrees, with values from -360 to 0, shown by the red line (6th line in the array). For convenience, we often use the antiphase values in combination with 360, which effectively raises it to the phase level.
Now, let’s talk about amplitude. Calculated with a factor of 1, it’s displayed in points as the orange line (9th line in the array).
- Averaging via a second or fourth-degree polynomial enhances the smoothness of the lines, adding inertia and rhythm.
- Using a sinusoidal extrapolation function near a constant can help you adjust for delays or leads.
- The value of the phase—essentially the state parameter of the wave—is similar to the trigonometric phase or the rotation angle of a radius vector in the trigonometric plane. This lets you digitize every point on the line, enabling you to use any necessary point as a trading signal, speeding up your strategy optimization.
- With digitization, you can establish asymmetric resolution and prohibition intervals during filtering. For instance, you might set a prohibition interval of 90 degrees against the trend, starting from any phase—just a quarter of the entire wave period!
If you're interested, here's the MT4 version.
Additionally, you can refine your understanding with resources like the Difference Calculus examples.
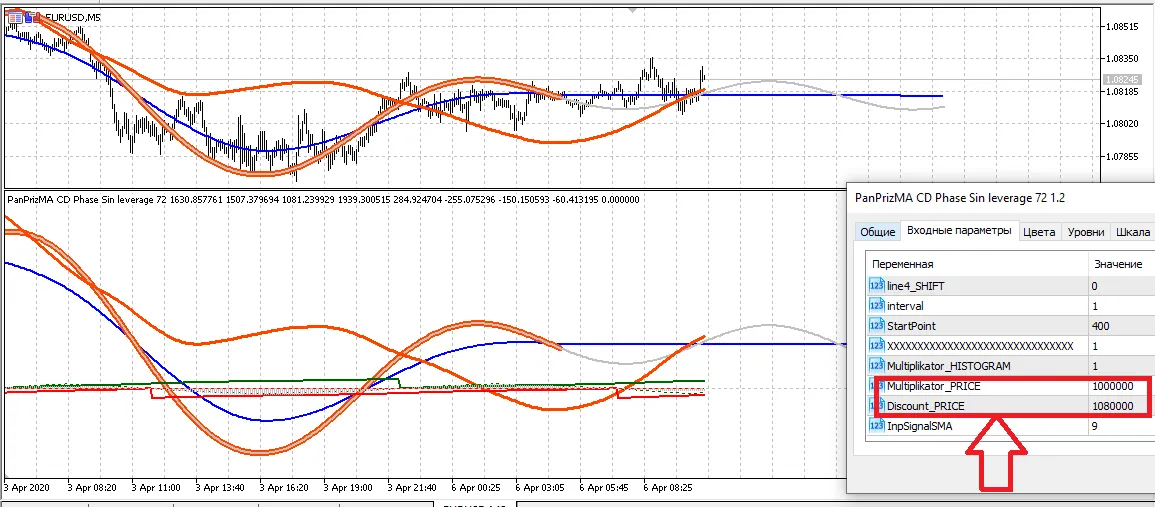
It's worth noting that there are some “crutches” within the indicator that can help display the initial lines of the PanPrizMA Sin leverage 72 indicator.


Comments 0