Theory:
The theory behind the RSI Summed indicator is quite straightforward:
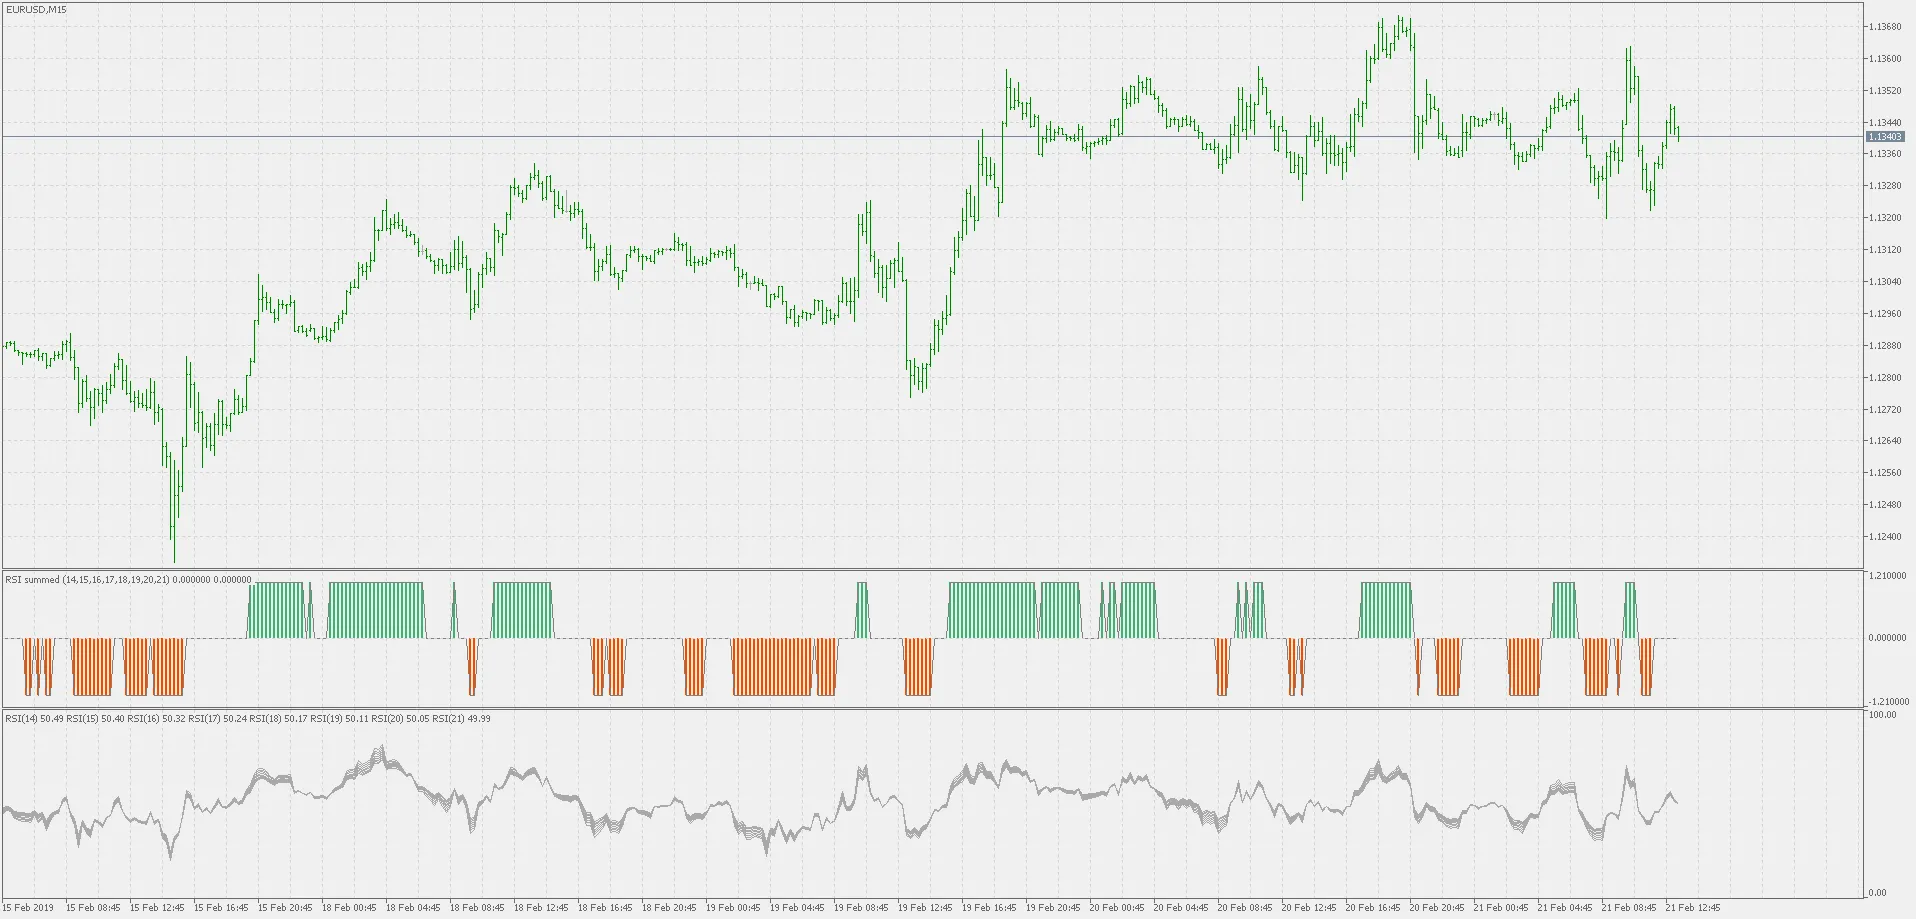
This indicator evaluates a set number of RSI values defined by the periods parameter. It checks if all specified RSI values are either above or below a designated level. If they’re all above, it indicates an upward state; if they’re all below a certain low level, it indicates a downward state. If neither condition is met, it shows a neutral state. While some might argue that you could assess the slowest RSI alone, this approach can sometimes miss crucial signals, depending on the periods used. That’s why this indicator evaluates all the specified RSI values.
You can define the periods as a list separated by “:”. The default setting is 14;15;16;17;18;19;20;21.
Usage:
Utilize the color changes as trading signals:
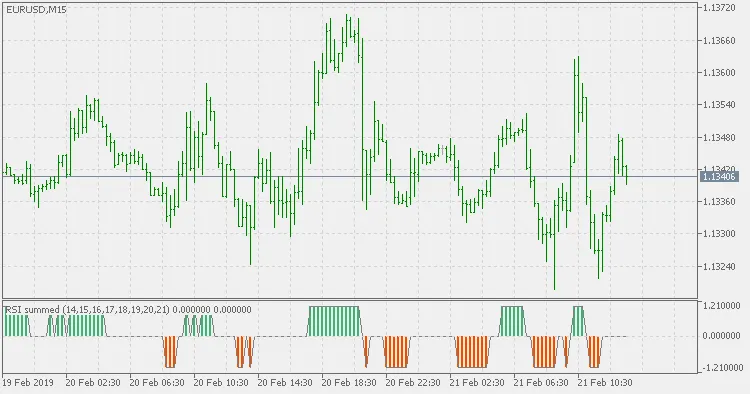
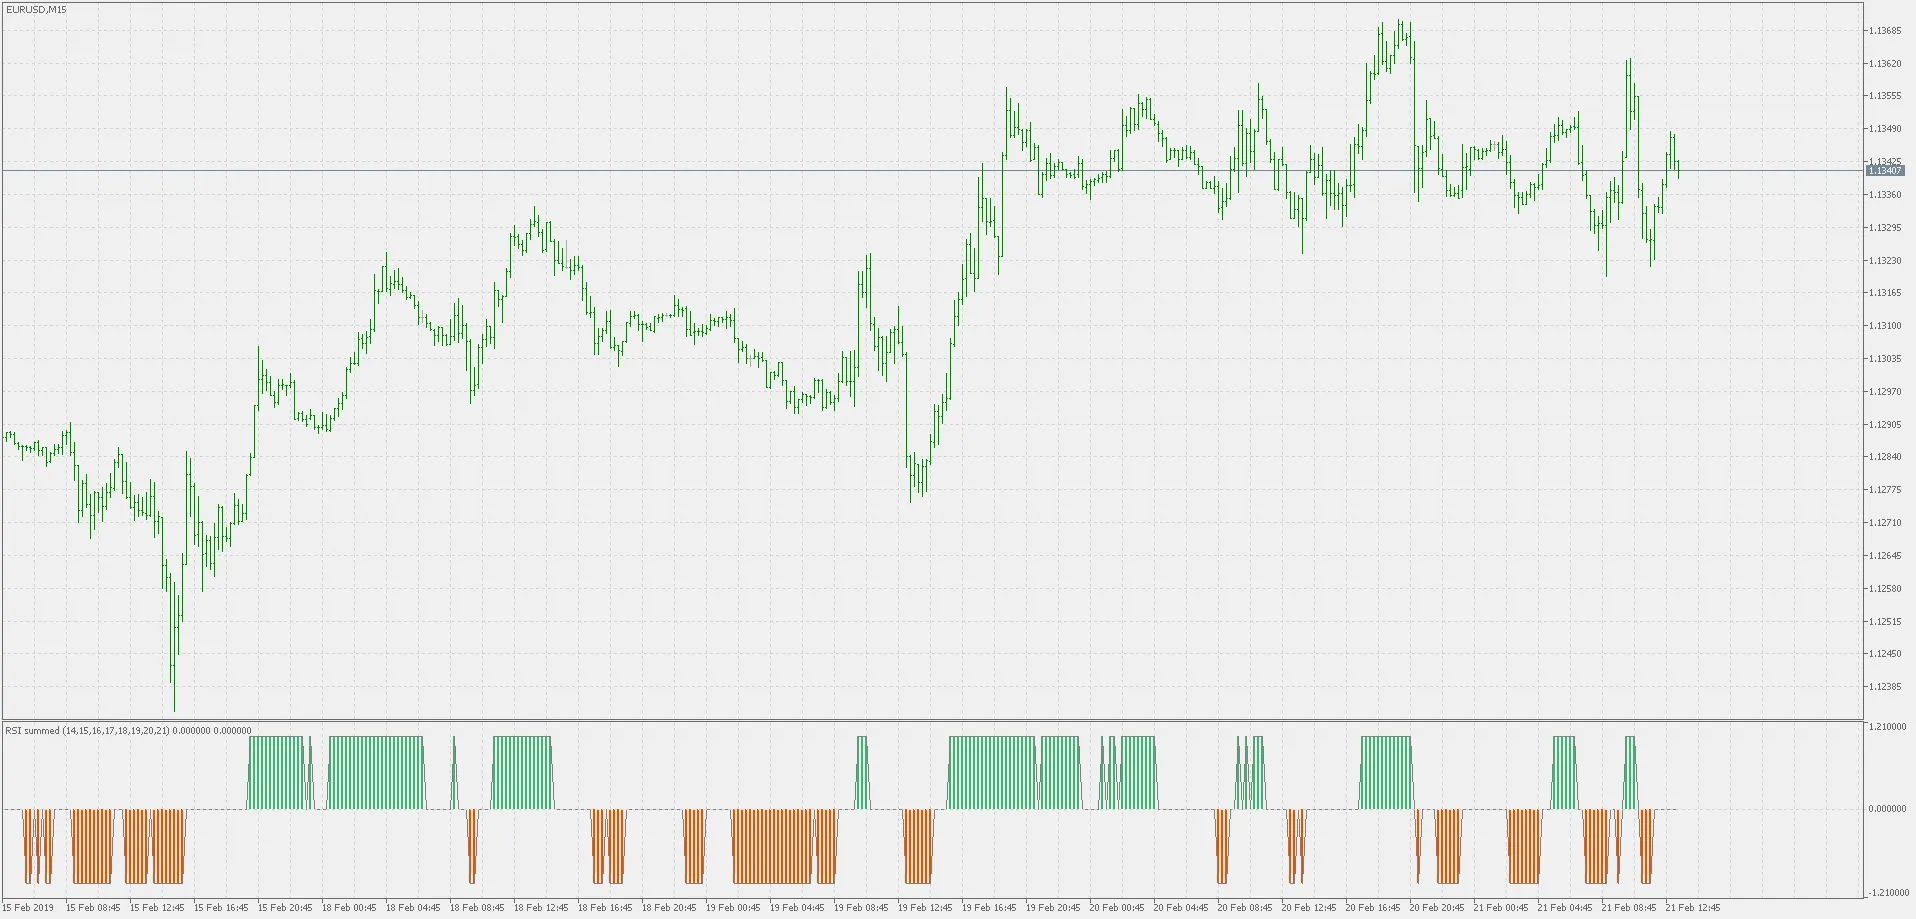
Note: The images provided give a comparison based on the selected RSIs.


Comments 0